Deploy and profile an AI model
After creating a workspace from an AI model, use the AI Hardware Profiling view to deploy your model to hardware and capture performance metrics. This interface guides you through hardware configuration, deployment, and profiling data collection.
Before you start
Ensure you have:
- Created a workspace using Create workspace from AI model
- Waited for the initial build to complete (status shows Built)
- Connected your development board hardware - see Connect hardware for detailed connection instructions:
- Debug probe connected (such as J-Link or CMSIS-DAP)
- USB/UART cable connected for serial output
- Identified your serial port designation on your host system (see Connect hardware)
Open the AI Hardware Profiling view
If you just created the workspace, the AI Hardware Profiling view (.cfs/ai.cfsaiprof file) opens automatically.
If you closed the view or are returning to an existing workspace:
- In the VS Code Explorer, navigate to the
.cfsfolder in your workspace - Open the
ai.cfsaiproffile
The profiling interface appears with hardware configuration options and status indicators.

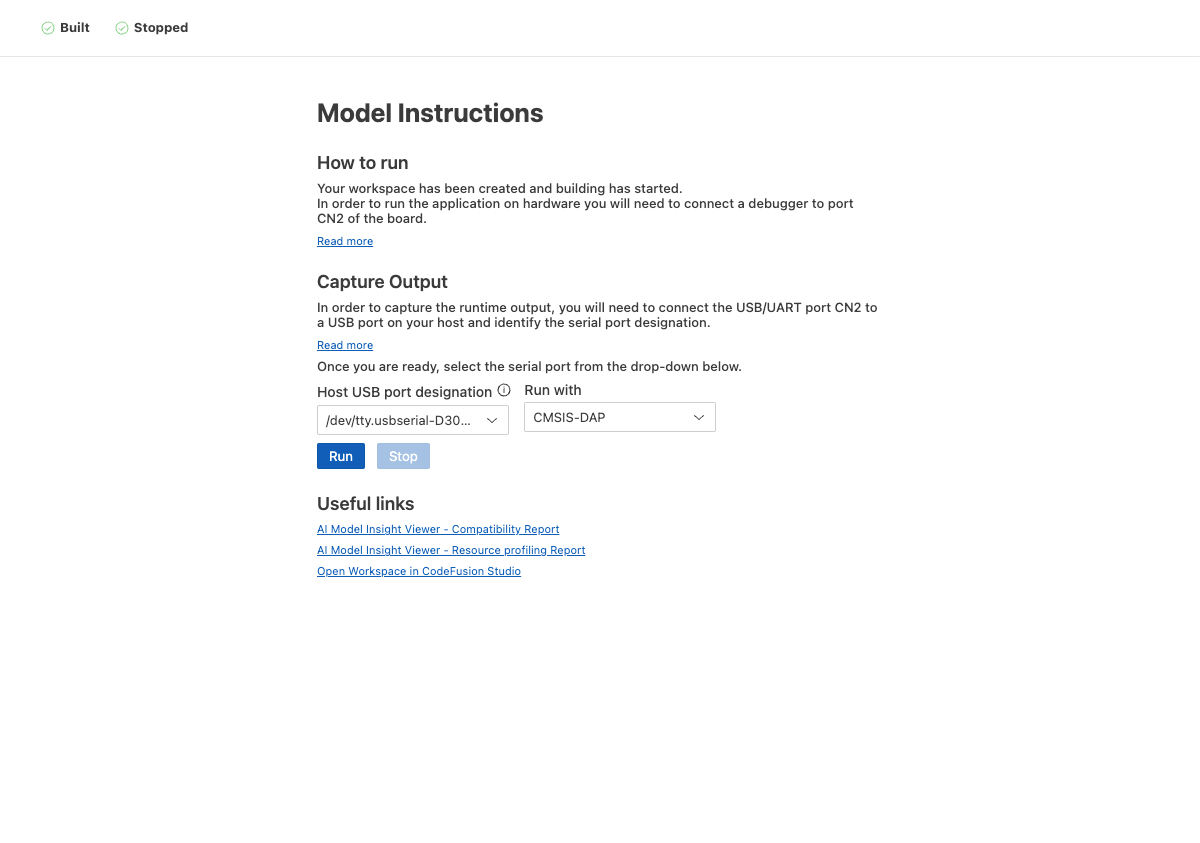
Understanding the interface
The AI Hardware Profiling view contains several key sections:
Status indicators
Two status indicators appear at the top of the view:
| Status | Possible Values | Description |
|---|---|---|
| Building | Building → Built → Error | Indicates compilation status of the AI application. Must show Built before deployment. |
| Deploy status | Undeployed → Deploying → Running → Stopped → Error | Tracks model deployment and trace capture status. |
Model Instructions
This section provides guidance for hardware setup:
- How to run: Explains that you need to connect a debugger to flash the application to your board. Select Read more for detailed connection instructions.
- Capture Output: Explains that you need to connect a USB/UART port to capture profiling data from the board. Select Read more for port identification guidance.
Note
The <portNumber> placeholders in these messages refer to specific ports on your development board. Consult your board's documentation or see Connect hardware for board-specific connection diagrams.
Configuration options
Before deploying, configure your hardware connections:
- Host USB port designation: Dropdown menu of available serial ports detected on your system. Select the port that corresponds to your board's UART connection.
- Run with: Dropdown menu of available debuggers. Select your debug probe type (such as J-Link or CMSIS-DAP).
Deploy the model
Follow these steps to deploy your AI model to hardware:
-
Wait for the build to complete. The Building status indicator should show Built.
Tip
If the build fails (status shows "Error"), check the Terminal panel (View → Terminal) for compilation errors.
-
Verify your hardware connections are complete:
- Debug probe is connected to your board and recognized by your system
- USB/UART cable is connected
- Board is powered on
For detailed connection instructions, see Connect hardware.
-
In the Run with dropdown, select your debug probe type:
- J-Link - for Segger J-Link debuggers
- CMSIS-DAP - for CMSIS-DAP compatible debuggers (including MAX32625PICO)
-
In the Host USB port designation dropdown, select the serial port that corresponds to your board's UART connection.
Example
Typical port names:
- Windows:
COM3,COM4, etc. - macOS:
/dev/tty.usbserial-* - Linux:
/dev/ttyUSB0,/dev/ttyACM0, etc.
If you're unsure which port is correct, see Identify serial port designation.
- Windows:
-
Click the Run button.
The deployment process begins:
- Status changes from Undeployed to Deploying
- The application is flashed to the hardware using the selected debugger
- Once flashing completes, status changes to Running
- The system begins listening on the serial port for profiling trace data
-
Press the Reset button on your board to restart the application and begin trace data transmission.
For applications that run once and exit (such as the AI model profiling examples), you may need to press Reset multiple times to capture additional trace data.
-
When you have collected sufficient trace data, click the Stop button to end the capture session. The status changes to Stopped and a notification displays Traces captured successfully with links to the generated trace files.
If no traces were captured, you will see a notification saying No traces were captured. See Troubleshooting for common causes.
View profiling results
After successfully capturing traces, the notification provides links to the generated .tef files. Click a file link to open it in the Zephelin Trace Viewer.
The trace viewer displays profiling information based on the options enabled in System Planner's Profiling tab. For details on available profiling options and how to interpret trace data, see Profiling.
For a better viewing experience, right-click the trace viewer and select Move to New Window to get a full-screen view.
Troubleshooting
Issue: "No traces were captured" notification appears after clicking Stop
The board may not be sending profiling trace data. Common causes:
- You did not press the Reset button on the board after clicking Run. The board must reset to start sending trace data.
- Profiling options not configured: Open System Planner → Profiling tab and verify that profiling features are enabled for your core. For best results, enable at least AI Model Profiling plus one or more additional options (Application Callgraph, CPU Load, or Memory Usage). After making changes, click Generate Code, then reopen the AI Hardware Profiling view (
.cfs/ai.cfsaiprof) to trigger a rebuild and try capturing again. - Wrong serial port selected: Verify you selected the correct serial port for your board's UART connection. See Identify your serial port.
- Serial port in use by another application: Close any serial monitor, terminal, or other application that might be using the same port.
- Board did not run: Verify the board is powered on and the firmware was flashed successfully. Check the Terminal panel for flash errors.
Issue: Deployment fails with Model Deployment failed error
Check the Terminal panel (View → Terminal) for the specific error message and details.
Issue: Build status stuck on Building
The initial build can take several minutes depending on your system:
- Check the Terminal panel to see build progress
- For build errors, check that all required packages and toolchains are installed for your selected SoC
Next steps
- Analyze captured trace data in the Zephelin Trace Viewer to examine inference timing and performance
- Generate Compatibility Analyzer report and Resource Profiling report for additional static analysis of your model using the Embedded AI Tools
- For more advanced profiling workflows and configuration options, see Profiling