Profiling
Use the Profiling feature in CodeFusion Studio to capture and visualize profiler traces from your Zephyr project. The profiler provides detailed, operator-level profiling for AI models, enabling deep analysis of inference performance alongside system-level metrics.
Beta feature
The Profiling tool is currently in beta. Some options or trace formats may change in future releases.
About Zephelin
Antmicro developed Zephelin as a middleware layer for Analog Devices. It extends Zephyr RTOS with advanced tracing and profiling capabilities, specializing in detailed AI operator-level performance analysis. Zephelin also captures system-level events such as task switches, interrupts, and timing information, providing a complete view of both AI inference and runtime behavior.
Before you start
Before you begin, create a Zephyr workspace using the Workspace Creation Wizard. What you can profile depends on your processor and template:
- Basic system profiling (CPU load, memory usage, and application call graph) works with any Zephyr project — including non-AI templates such as Zephyr Single Core Blinky. Just enable the Zephelin Profiler in System Planner. To add AI model profiling to an existing non-AI project, add a model configuration as described in Embedded AI Tools.
- AI inference profiling (per-operator TensorFlow Lite Micro timing) requires an AI-capable processor and a configured model. The Zephyr Single Core TensorFlow AI Inference Profiling template is the recommended starting point. It runs the same inference as the Zephyr Single Core TensorFlow AI Model template, with the Zephelin Profiler already configured. Supported processors include MAX32657, MAX32690, and MAX78002. This template runs its inferences once at startup. Use UART to capture inference traces; UART is selected by default.
-
USB trace capture is supported on MAX32690 on macOS and Linux hosts. Other supported processors capture traces over UART.
Note
On MAX78002, MAX32650, and MAX32666, USB trace capture is not available in this release because the High-Speed USB peripheral is not yet supported in the Zephyr devicetree, and selecting USB generates code that fails to build. Use UART to capture profiling traces on these processors. See the release notes.
Configure and capture a profiling trace
To capture profiling traces from your Zephyr project, set up the trace peripheral and configure the profiling options in System Planner, build and flash your project, then use the Trace Capture panel to collect trace data.
Step 1. Set up the trace peripheral
Open System Planner in your Zephyr workspace. The trace peripheral is configured in the Peripheral Allocation and Clock Configuration tools, both within System Planner. Set up the peripheral for the interface you plan to use before you configure the profiler in Step 2, so it is available when you select the trace interface.
For UART
- Open Peripheral Allocation. If a UART peripheral is not already allocated to the application core, allocate one and configure its pin assignments as needed.
- With the peripheral selected, select Configure

 to open the Peripheral Settings Sidebar.
- In the Code Generation Plugin section, set (or confirm) the baud rate. This is the single source of truth for the UART baud rate: it is compiled into your firmware during code generation, and it is the value shown (read-only) in the Baud Rate field on the Profiling screen.
-
When you later capture a trace (see Step 4), set the same baud rate in the Trace Capture panel. The host and the device must agree. If they do not match, the capture typically fails with a Capture interrupted error (see Capture interrupted), or produces unreadable trace data.
For complete details on allocating and configuring peripherals, see Peripheral Allocation.
For USB
USB trace capture is supported on MAX32690 in this release. These steps apply to MAX32690.
- Open Peripheral Allocation. If the USB peripheral is not already assigned to the application core, assign it. It typically appears as USBHS in the peripheral list.
- Open Clock Configuration, expand the Peripheral section, and select and enable the USB peripheral. It typically appears as High-Speed USB.
- Complete any additional clock settings the tool exposes. On MAX32690, this includes a selectable Clock Source for USB PHY. CodeFusion Studio provides a valid default; if you change the system clock configuration, follow any signposts or validation messages shown in Clock Configuration to keep the USB clock within the range the peripheral requires.
-
Connect an additional USB cable from your host PC to the USB device-controller connector on the board. USB trace data streams from the USB device controller on the processor, which is a dedicated connector, separate from the connectors used for power, debug, and serial output in your normal board setup. If this cable is not connected, the trace device does not enumerate and does not appear in the Trace Capture device list.
Connector labels differ by board — check the documentation for your board. For example, on the MAX32690 EVKIT, power and serial output come in over CN2 and debug over J3, while USB trace data is carried on CN1.
Keep your normal board connections in place and add the USB trace cable in addition to them. For general guidance on connecting your board, see Connect hardware.
Step 2. Configure profiling options
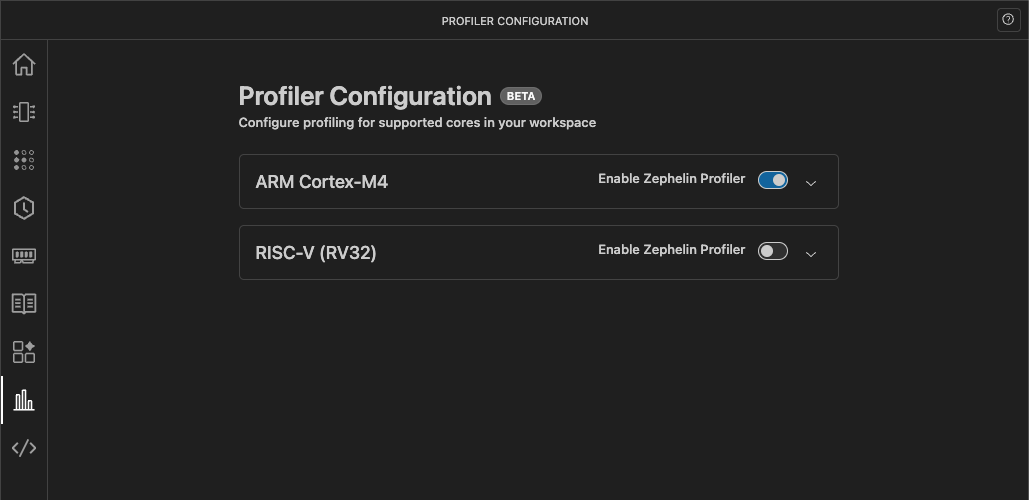
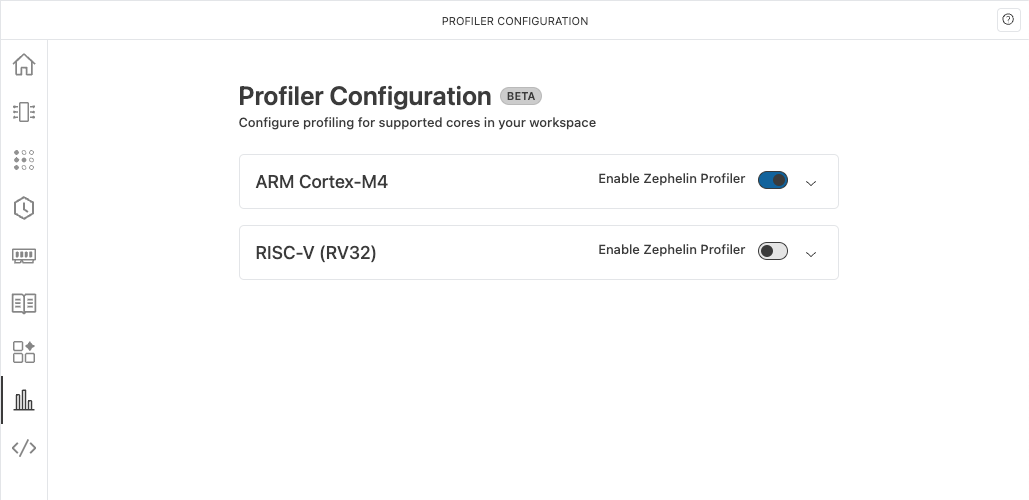
- In System Planner, click the Profiling tab to see a list of cores in your workspace.
-
Turn on Enable Zephelin Profiler for each core you want to profile.
-
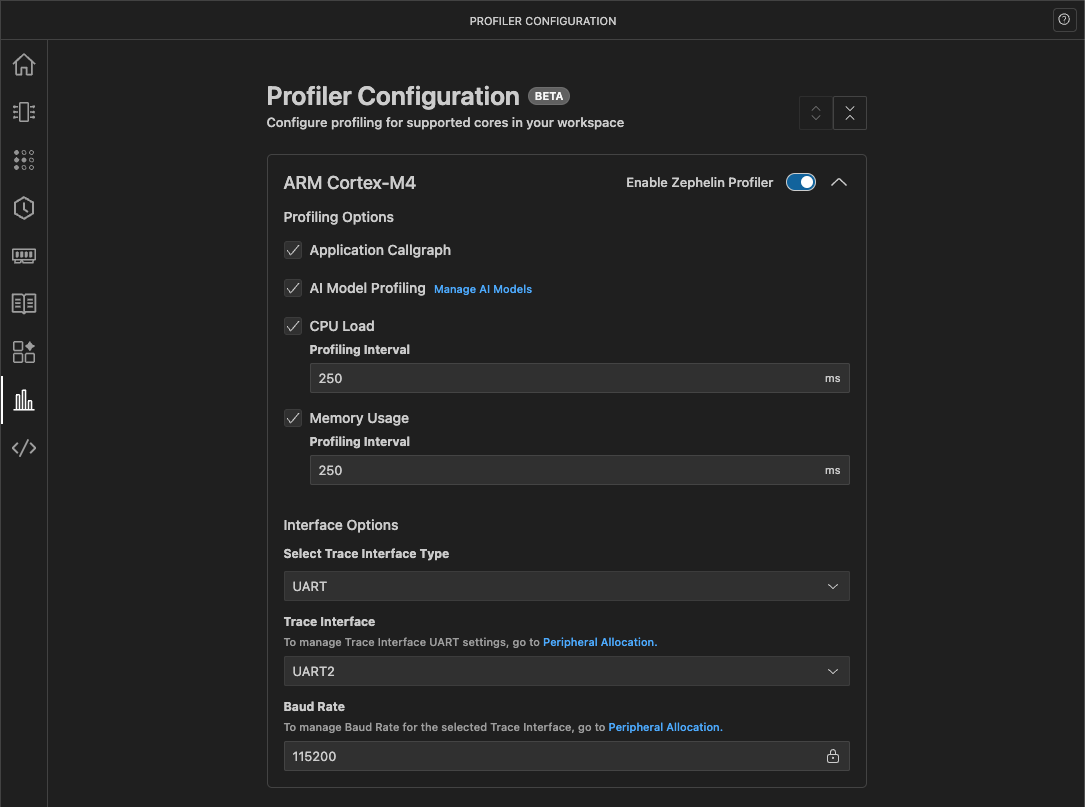
Click the expand arrow to configure profiling options for the selected core.

-
Configure the Profiling Options:
- Application Callgraph – Enables instrumentation subsystem for capturing function call graphs and application-level tracing. Instrumentation starts when the trigger function enters and stops when the stopper function exits. By default, CodeFusion Studio uses the
mainfunction, capturing execution from whenmain()starts until it returns (if it returns). To customize these functions or learn more, see Advanced: Customize instrumentation trigger and stopper functions. - AI Model Profiling – Enables TensorFlow Lite Micro inference tracing for supported processors. Only available when AI models are configured. For details, see Supported processors and model formats and Embedded AI Tools.
- CPU Load – Monitors CPU usage by sampling at regular intervals. When enabled, specify the profiling interval in milliseconds. The system reads the CPU load value at this interval and reports it to the host PC.
- Memory Usage – Tracks memory consumption by sampling at regular intervals. When enabled, specify the profiling interval in milliseconds. The system reads the memory usage value at this interval and reports it to the host PC.
- Application Callgraph – Enables instrumentation subsystem for capturing function call graphs and application-level tracing. Instrumentation starts when the trigger function enters and stops when the stopper function exits. By default, CodeFusion Studio uses the
-
Configure the Interface Options:
- Select Trace Interface Type – Select the interface used to transmit trace data to the host PC. Options include UART and USB.
If you select UART:
- Trace Interface – Select the UART peripheral used for trace output (for example, UART0, UART2, or LPTUART0). The available options depend on your SoC and which UART peripherals are allocated to this project in Peripheral Allocation.
- Baud Rate – Displays the baud rate of the selected UART peripheral (typically 115200 for profiling). This field is read-only and reflects the value set in Peripheral Allocation.
The UART peripheral you select here is the one you allocated in Step 1, and its baud rate is set there too.
If you select USB:
- USB requires no additional fields on this screen. You assigned the USB peripheral and configured its clock in Step 1.
Step 3. Generate, build, and flash
- In System Planner, click Generate Code.
- Enable Generate AI Models if your project includes an AI model.
-
Run the following CFS tasks:
- CFS: build – Compiles your project (for example, creates
m4/build/zephyr/zephyr.elf). - CFS: flash or CFS: flash & run – Programs your board using your configured debugger/runner (for example, OpenOCD or J-Link).
You can run these tasks from the Command Palette, Actions view, or using
cfsutilfrom the terminal. - CFS: build – Compiles your project (for example, creates
Step 4. Capture the profiler trace
-
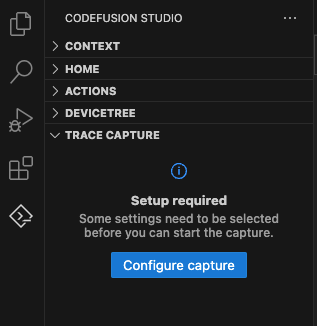
Go to the Trace Capture section in the CFS sidebar.
-
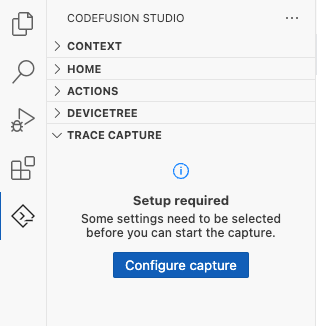
If you see either a Setup required or Source not available message, select Configure capture to open the trace capture settings and select or reselect your trace source — the serial port for UART, or the USB device for USB.
-
In the Trace Configuration view, configure the following settings:
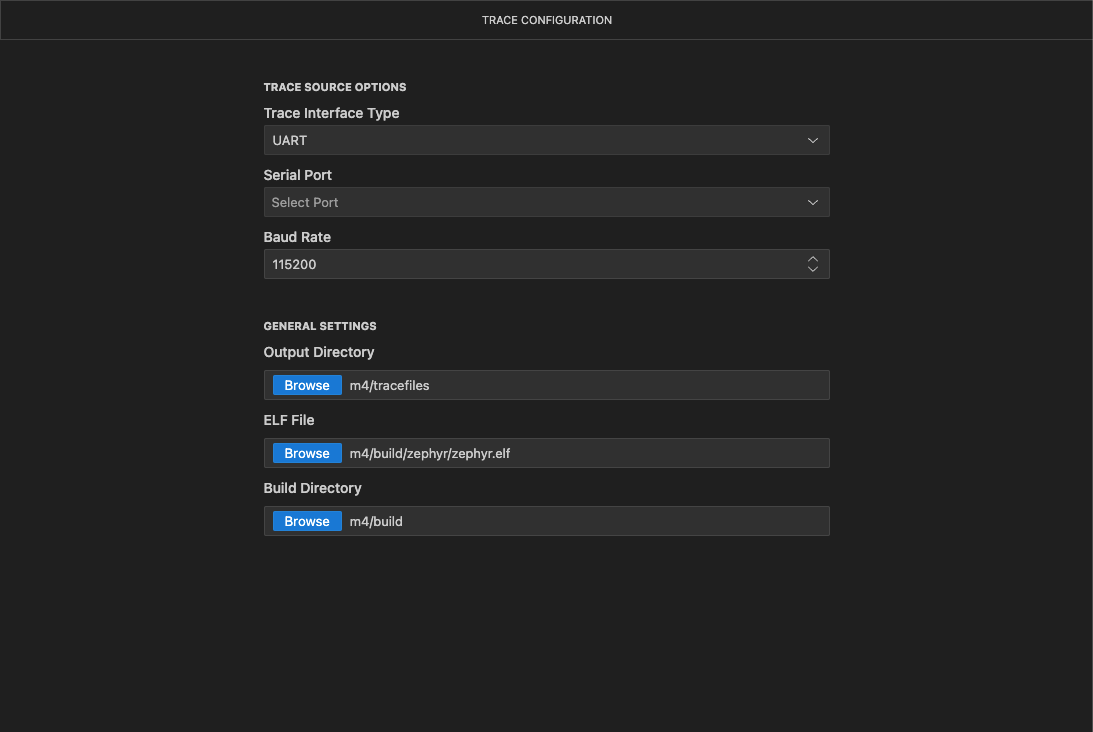
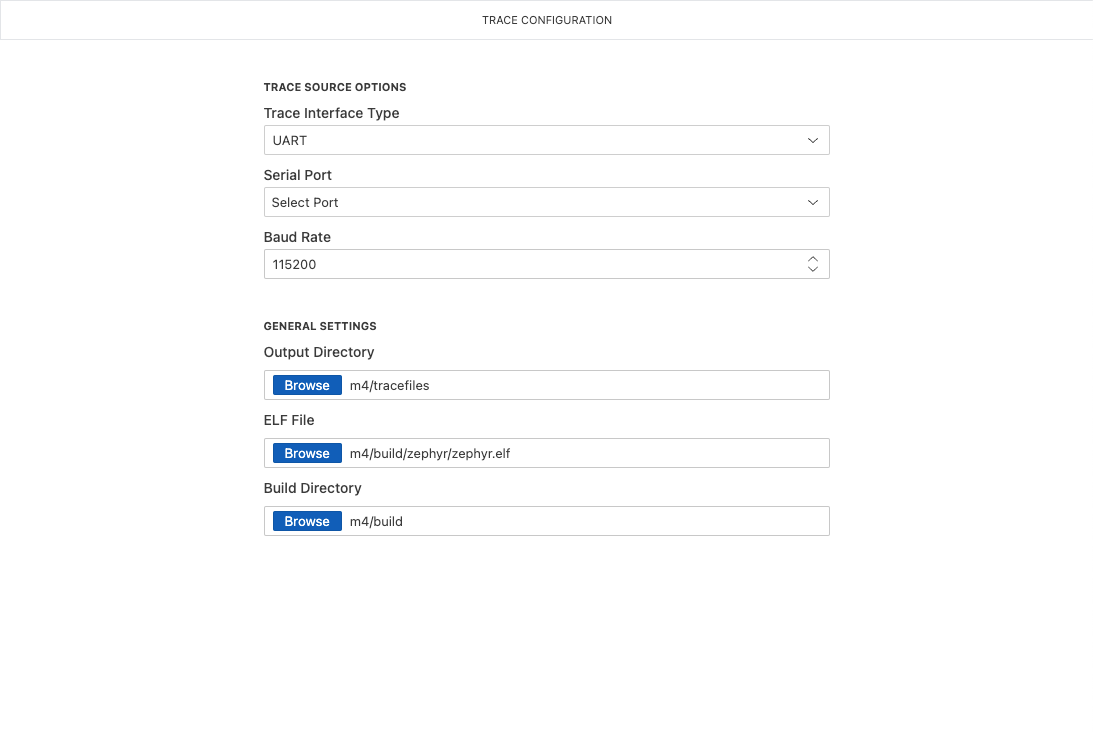
Trace Source Options:
- Trace Interface Type – Select the interface used to transmit trace data.
If you select UART:
- Serial Port – Select the serial port connected to your board. On Linux/WSL, this appears as
/dev/ttyUSB0or similar. On macOS, this typically appears as/dev/tty.usbserial*or/dev/cu.usbserial*. On Windows, this appears asCOM3,COM4, or another COM port. Ensure the port name matches your system exactly. - Baud Rate – Set the baud rate for the trace interface. This field defaults to 115200. Ensure this value matches the baud rate configured in your application's firmware. Click the reset indicator to restore the setting to its default value.
If you select USB:
- USB Device – Select the connected USB device from the list. The profiler firmware advertises itself as Zephelin, so the entry usually appears as Zephelin - Bus xxx, Device xxx. If the host can't read the product name, the entry falls back to Bus xxx, Device xxx with no name. The bus and device numbers are assigned by the host and can change when you reconnect or reflash the board, so use them only to tell devices apart, not as a fixed identifier. If no devices appear, build and flash firmware with USB tracing enabled, and confirm that the firmware is running. The USB Device list only shows connected Zephelin devices running on the USB bus. Reopen the list to refresh it.
General Settings:
- Output Directory – Specifies where trace files will be saved. By default, this is derived from the first non-
.cfsworkspace folder, for example<core>/tracefiles. Click Browse to select a different location if needed. - ELF File (Optional) – The application binary file passed as metadata during trace conversion from binary format to TEF (Trace Event Format). By default, this is derived from the first non-
.cfsworkspace folder, for example<core>/build/zephyr/zephyr.elf. Providing the ELF file enables symbolization of trace data, allowing the trace viewer to display function names and source code locations in the profiling results. Click Browse to select a different file if your binary is located elsewhere. If you leave this field empty, you can still start capture and conversion, but the UI displays a warning: ELF not set. Trace conversion may fail depending on your configuration. - Build Directory (Optional) – The application build output directory passed as metadata during trace conversion. By default, this is derived from the first non-
.cfsworkspace folder, for example<core>/build. This helps locate debug symbols and source mappings when converting trace data to TEF. Click Browse to select a different directory if your build output is located elsewhere.
-
Return to the TRACE CAPTURE panel and click Start Capture.
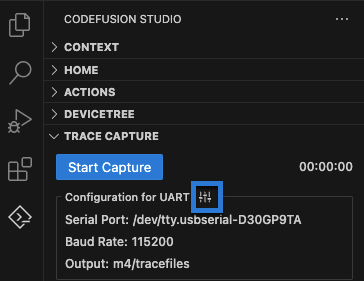
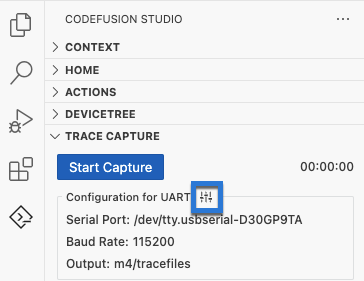
Tip
The Configure button (highlighted in the screenshot above) lets you modify trace settings in the Trace Configuration view after initial setup.
Note
Trace capture needs exclusive access to the trace device. For UART, close any serial monitor or terminal using the port before starting capture. For USB, make sure no other application has claimed the device.
If another process is using the same device, the capture will fail with an error message. -
While capture is running, the TRACE CAPTURE panel displays an elapsed time timer. The configuration settings are disabled until you stop the capture.
-
Begin trace data transmission. The method depends on your trace interface.
For UART, restart your application while capture is running. The two most practical approaches are:
- Reset button – If your board has a reset button, press it while capture is running.
- CFS: flash & run – Run the CFS: flash & run task and wait for flashing to complete. Depending on your runner, the target may reset more than once during the operation, which can result in multiple trace files being generated during a single capture session.
For applications that run once and exit (for example, the Zephyr Single Core TensorFlow AI Inference Profiling template), you may need to restart multiple times to capture additional trace data.
For USB, trace capture is handled differently. The trace cannot start while the device is flashing or held in reset, and the device disappears from the USB Device list at those moments. Do not reset or reflash the board to trigger transmission. Instead, flash and start your application first, confirm it is running, then start capture. You can start capture at any point while the device is connected and running.
Note
USB captures only traced activity that occurs after capture starts. It therefore cannot capture inference traces from applications that run their inferences once at startup, such as the Zephyr Single Core TensorFlow AI Inference Profiling template. The inferences finish before capture can attach, and resetting the board to re-run them disconnects the USB device. Periodic metrics such as CPU Load and Memory Usage remain available. Use UART to capture traces from applications that run their inferences at startup.
-
Click Stop Capture when you have collected sufficient trace data.
-
When the capture completes successfully, a notification displaying Traces captured successfully appears with links to the generated trace files. Click a file link to open it directly, or click Choose a file to open to select from the full list.
If you used CFS: flash & run, open the
.teffile with the latest timestamp. If multiple.teffiles share the latest timestamp, choose the.teffile created most recently (typically the one with the highest numeric suffix), for exampletracefile_20260622_161602_1.tef.
Note
Trace files are saved in your output directory using the naming pattern tracefile_YYYYMMDD_HHMMSS[_N], where a numeric suffix is added if multiple traces share the same timestamp. Two formats are generated:
.ctf– Binary trace data..tef– JSON trace data for the Zephelin Trace Viewer.
Each application restart produces a separate pair of trace files.
CLI-based trace capture
For a terminal-based workflow, you can use cfsutil tasks run with the --capture and --port flags to automatically capture and convert trace data:
cfsutil tasks run flash_run_JLink --capture --port /dev/ttyUSB0 --project m4
The --capture and --port flags support UART serial ports only. To capture over USB, use the Trace Capture panel in VS Code.
Visualize trace data
The Zephelin Trace Viewer extension is automatically installed as a dependency of the CodeFusion Studio extension. To verify installation, view the Dependencies tab in the CodeFusion Studio extension details.
You can open trace files in two ways:
- Immediately after capture: When the capture completes successfully, a notification displays Traces captured successfully with links to the generated trace files. Click a file link to open it directly, or click Choose a file to open to select from the full list.
- From Explorer (to revisit previously captured traces): In the VS Code Explorer view, locate the
.teffile and click it to open in the Zephelin Trace Viewer.
For a better viewing experience, right-click the trace viewer and select Move to New Window to get a full-screen experience.

The trace viewer displays detailed profiling information based on the options you enabled in the Profiling Configuration:
- CPU Load – Shows CPU usage sampled at the configured interval
- AI Model Profiling – Displays inference time per layer for TensorFlow Lite Micro models
- Memory Usage – Shows per-thread memory consumption with multiple visualization types
Tip
You can also use the web-based Zephelin Trace Viewer, though the integrated extension provides a more seamless experience.
Zephelin documentation
For advanced configuration options—such as memory profiling and tracing scopes—see the official Zephelin documentation. These options can also be enabled in CodeFusion Studio through project configuration files.
Troubleshooting
Capture interrupted
If the connection to the trace device is lost during capture — for example, the serial connection drops or the USB device is disconnected — the Trace Capture panel displays Capture interrupted with two options:
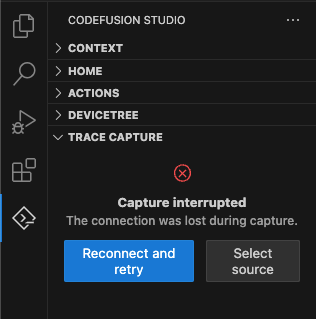
- Reconnect and retry – Reconnects to the selected trace device and starts a new capture with your existing settings. This begins a new trace file rather than continuing the interrupted one. For USB, this works only if the device still has the same bus number and address. If it re-enumerates with a new address after disconnecting, use Select source to reselect it.
- Select source – Opens the Trace Configuration view so you can reselect the serial port or USB device, adjust the baud rate (UART only), or change the output directory.
Common causes of interrupted captures:
- Another application claimed exclusive access to the serial port
- The USB cable was disconnected or the board lost power
- The serial port device name changed (common on Windows after reconnecting USB devices)
- A mismatch between the baud rate in the Trace Capture panel and the baud rate compiled into the firmware (UART only), which can interrupt capture or produce unreadable trace data
If reconnection fails repeatedly, verify the correct trace source is selected (serial port for UART, USB device for USB) and that no other application (such as a serial monitor or terminal) is using it.
Trace file fails to open
If selecting a .tef file produces an unexpected error — for example, a dialog similar to:
Unable to open 'tracefile_YYYYMMDD_HHMMSS.tef'. Assertion Failed: Argument is undefined or null.
a compatibility issue with the installed version of the Zephelin Trace extension may be the cause.
To recover:
- If automatic extension updates are enabled (default):
- Reload the VS Code window to apply any pending extension updates — open the Command Palette (
Ctrl+Shift+P/Cmd+Shift+P) and run Developer: Reload Window. - If the error persists, disable automatic extension updates for the Zephelin Trace Viewer extension, then try installing a different version.
- Reload the VS Code window to apply any pending extension updates — open the Command Palette (
- If automatic extension updates are disabled: Try updating the Zephelin Trace Viewer extension first — the issue may already be fixed in a newer release. If that doesn't resolve it, try installing a different version.
Build fails with memory overflow after enabling profiling
Enabling Zephelin profiling options increases memory usage and may cause the build to fail with linker errors.
Error signature:
section 'XXXXX' will not fit in region 'XXXXX'
region 'XXXXX' overflowed by XXX bytes
ld returned 1 exit status
If you encounter this error, the device may not have sufficient memory to support profiling in the current application. You can try disabling some profiling options to reduce memory usage, but this may not resolve the issue.
USB capture shows metrics but no inference traces
If USB capture shows periodic metrics such as CPU Load and Memory Usage, but no inference traces, the application likely completed its inferences before capture attached. This occurs with applications that run their traced activity once at startup, including the Zephyr Single Core TensorFlow AI Inference Profiling template.
Capture over UART instead. Start capture, then press the reset button or run CFS: flash & run to re-run the inferences. The profiling template selects UART by default. For instructions, see Capture the profiler trace.
Advanced: Customize instrumentation trigger and stopper functions
When you enable the Application Callgraph profiling option, the instrumentation subsystem captures function call graphs and application-level tracing. Instrumentation starts when the trigger function enters and stops when the stopper function exits. By default, CodeFusion Studio uses the main function as both trigger and stopper, capturing the entire execution from when main() starts until it returns.
To customize which functions control the instrumentation scope:
-
Ensure the function is not inlined. To prevent inlining, specify the
__noinlineattribute in the function definition. This attribute is available from the<zephyr/toolchain.h>header.#include <zephyr/toolchain.h> __noinline void run_inference(void) { // Your code here } -
Run a pristine build to generate the ELF file containing the function symbols.
-
Extract the function symbol name from the built ELF file. For C projects, the symbol name matches the function name. For C++ projects, the function symbol is typically mangled and must be extracted from the ELF file.
nm <core>/build/zephyr/zephyr.elf | grep <function_name>For example, if your function is named
run_inference:nm m4/build/zephyr/zephyr.elf | grep run_inferenceThe output shows the symbol name. For C projects, this is typically the function name itself (
run_inference). For C++ projects, this will be a mangled name like_Z13run_inferencev.10002888 T _Z13run_inferencev -
Open the
prj.conffile in your project core directory and add the configuration options using the exact symbol name from the previous step. For example, if your core is namedm4, the file is located at<your-project>/m4/prj.conf.For C projects:
CONFIG_INSTRUMENTATION_TRIGGER_FUNCTION="run_inference"
CONFIG_INSTRUMENTATION_STOPPER_FUNCTION="run_inference"
For C++ projects (using the mangled name):
CONFIG_INSTRUMENTATION_TRIGGER_FUNCTION="_Z13run_inferencev" CONFIG_INSTRUMENTATION_STOPPER_FUNCTION="_Z13run_inferencev" -
Save the file.
-
Run a pristine build to apply the configuration changes, then reflash your project using CFS: flash or CFS: flash & run (see Generate, build, and flash).
cfsutil tasks run pristine_build --project <core> cfsutil tasks run <flash-task> --project <core> -
Capture a new profiling trace following the steps in Capture the profiler trace.
For more details about the instrumentation mechanism, see the Zephyr Instrumentation documentation.