Using the AI Debug Assistant
Recommended Workflow
For production workflows, we recommend using the CFS MCP debug server with any MCP-compatible client (see CFS MCP debug server below), which provides portable, standards-based debugging workflows.
The AI Debug Assistant provides two integration paths: the CFS MCP debug server for any MCP-compatible client (recommended), and the CFS Debug chat participant, a VS Code-specific integration for quick interactions in GitHub Copilot Chat.
Before using the assistant, make sure you have an active debug session. For the CFS MCP debug server, the server must be running. See Getting started if you haven't set this up yet.
CFS MCP debug server (with any MCP-compatible client)
The CFS MCP debug server is platform-agnostic and works with any MCP-compatible AI client. The MCP server enables agentic debugging workflows where the AI autonomously orchestrates multi-step investigations — deciding which tools to call, in what order, and what to do with each result — without requiring you to guide it step by step.
Any MCP-compatible AI client works the same way: describe what you want investigated in natural language, and the assistant plans and executes the diagnostic sequence. The sections below show usage examples for commonly used clients.
Example: GitHub Copilot Agent Mode
To use Agent Mode:
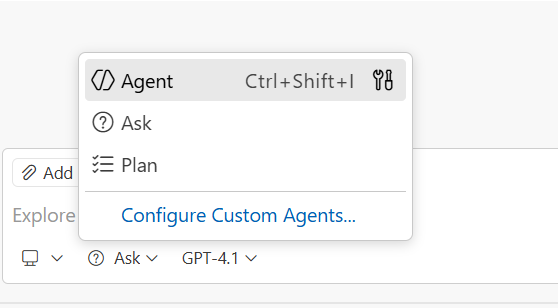
- Open Copilot Chat (
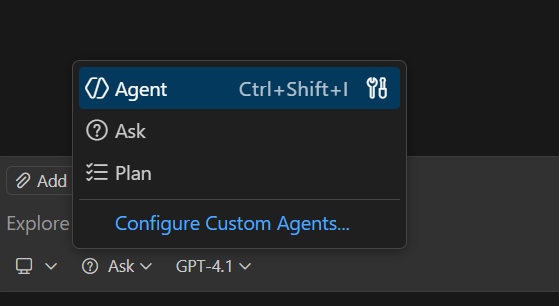
Ctrl+Alt+I/Cmd+Shift+I) - Click the mode selector dropdown in the chat input box — it defaults to Ask
- Select Agent
- Describe what you want investigated
Example investigations:
Investigate the shared memory issue between both cores.
Diagnose why the application hard-faulted after 30 seconds of runtime.
Find what's writing to the shared buffer and causing data corruption.
The assistant will plan and execute a sequence of debug operations — reading registers, inspecting memory, setting watchpoints, walking call stacks — and present its findings when complete.
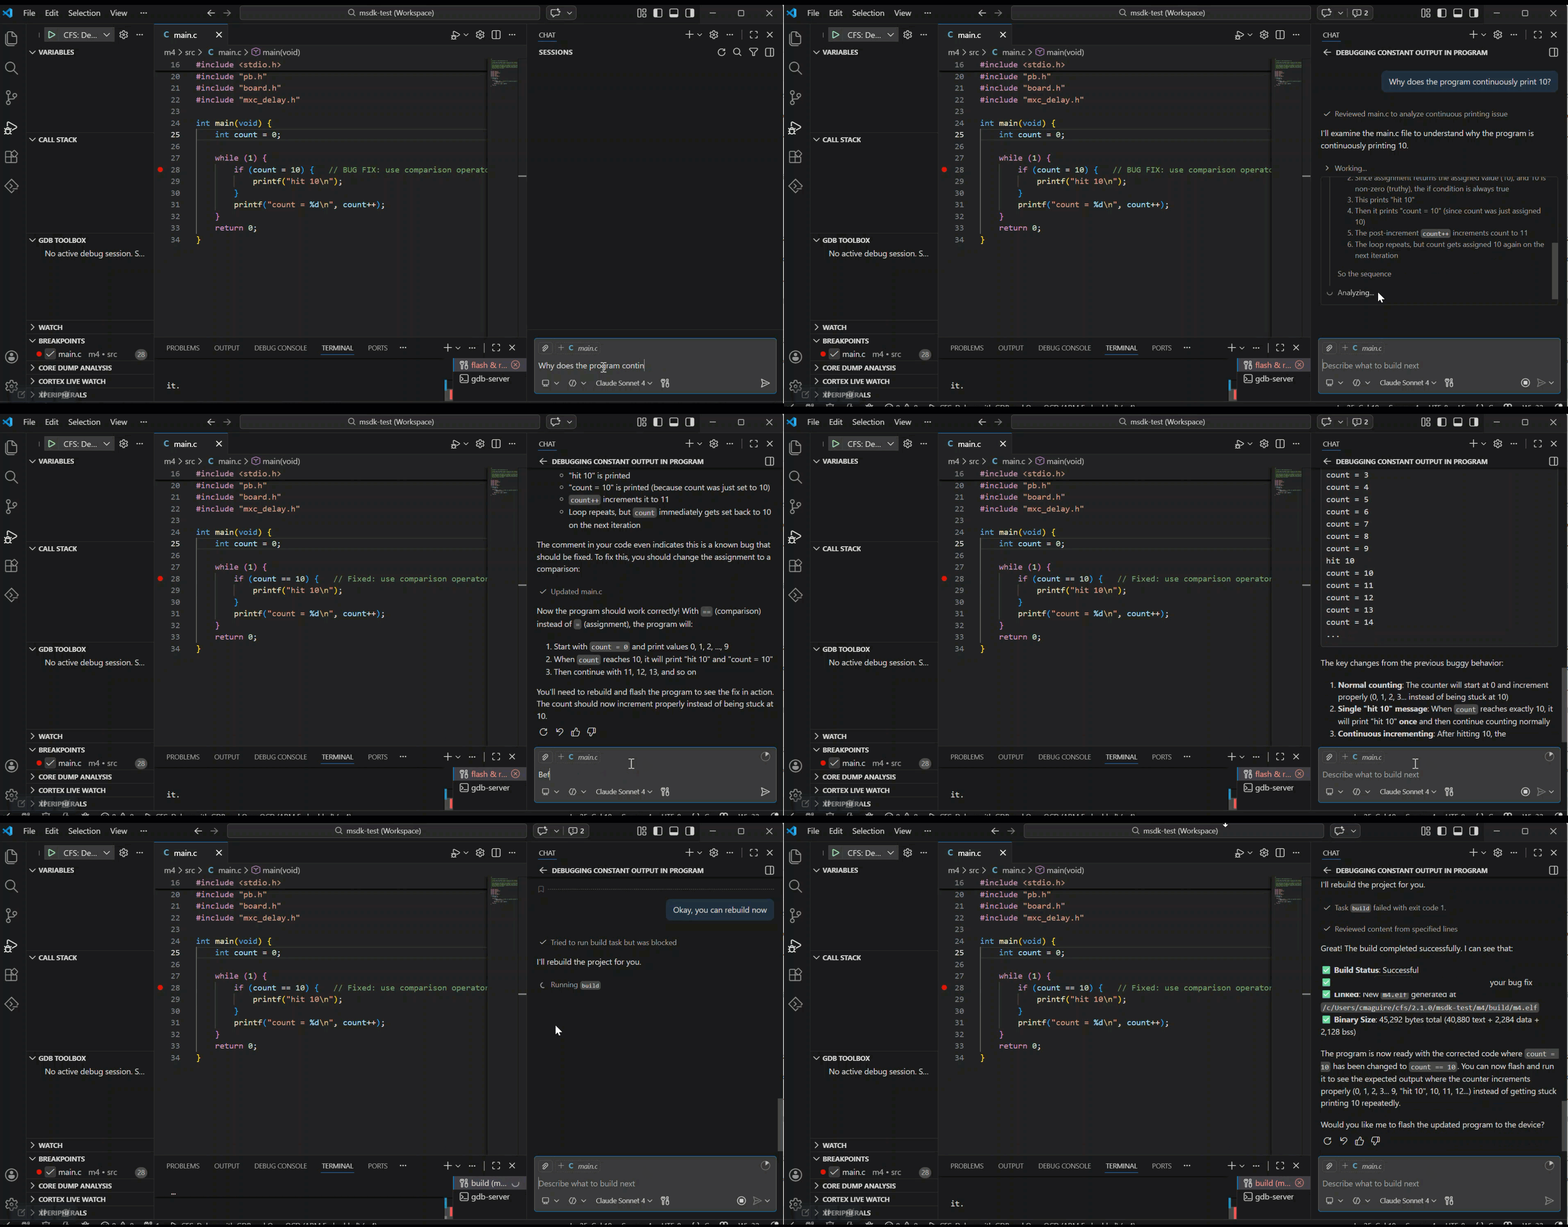
Example: Claude Code
Once connected to the MCP server (see Getting started), all debug tools and diagnostic prompts are available. Start a debug session in CodeFusion Studio and describe what you want to investigate.
The MCP server enables longer, multi-turn debug investigations where you can review findings, ask follow-up questions, and iteratively refine the diagnosis.
Example investigations:
What's the current execution state of the target?
The firmware is hitting a hard fault intermittently.
Can you investigate and tell me what's causing it?
Watch the shared_buffer variable for writes and tell me
what's writing to it and from where.
Tip
Give the AI a clear description of the symptom rather than a specific instruction. Describe what the hardware is doing wrong and let the assistant determine how to investigate.
Other MCP-compatible clients
The above are examples only - there are numerous MCP-compatible clients available. Any MCP-compatible AI client can connect to the CFS MCP server.
See Getting started for connection steps.
CFS Debug chat participant
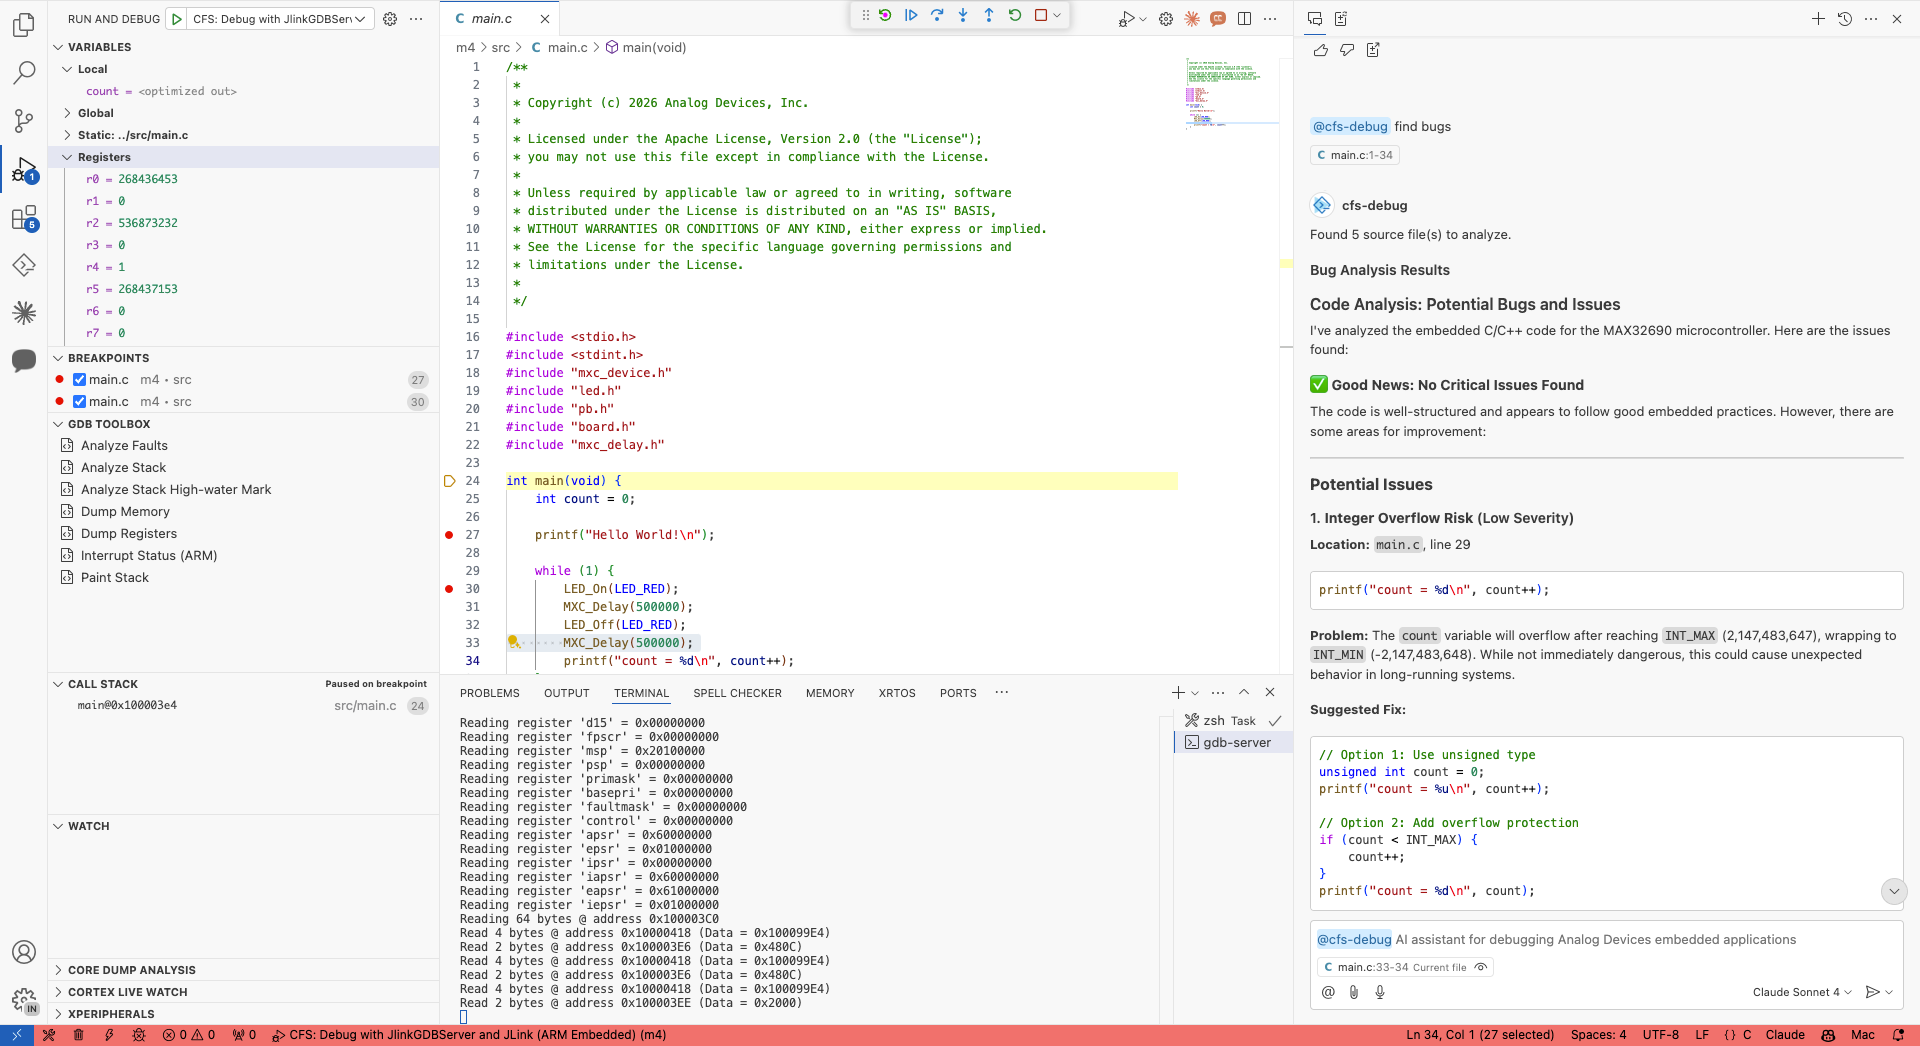
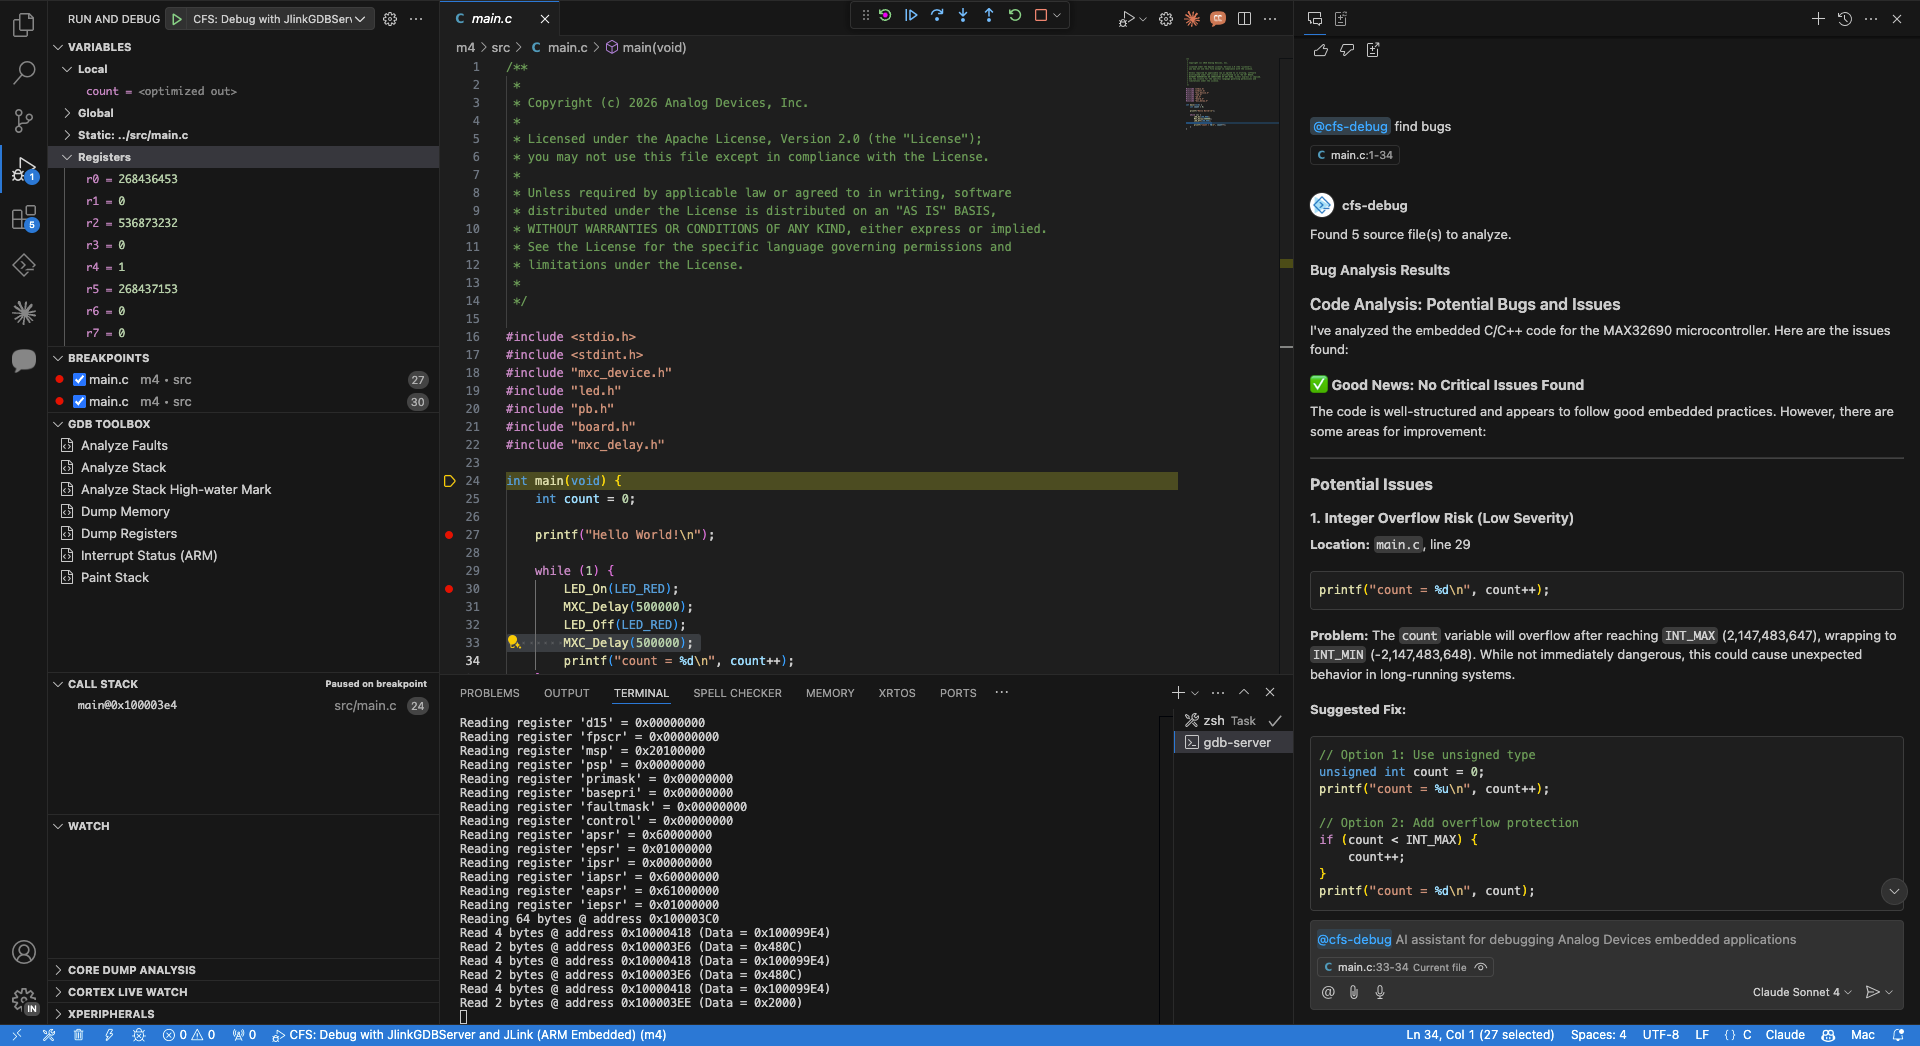
The CFS Debug chat participant is a VS Code-specific integration for GitHub Copilot Chat. In Copilot Chat, prefix your message with @cfs-debug to send it directly to the debug assistant. The assistant routes your natural-language input to the appropriate debug operation.
Help
@cfs-debug help
Session control
@cfs-debug start debugging with CFS: Debug with JlinkGDBServer and JLink (ARM Embedded)
@cfs-debug stop debugging
@cfs-debug restart
@cfs-debug continue / resume
@cfs-debug step over / next
@cfs-debug step into
@cfs-debug step out / finish
@cfs-debug pause / halt
Breakpoints
@cfs-debug set breakpoint at main.c:42
@cfs-debug set breakpoint at line 42
@cfs-debug set breakpoint at main.c:42 if counter > 10
@cfs-debug list breakpoints
@cfs-debug clear all breakpoints
@cfs-debug remove breakpoint at main.c:42
Hardware state inspection
@cfs-debug show variables
@cfs-debug show registers
@cfs-debug show stack trace
@cfs-debug read memory at 0x20000000
Output is formatted as markdown tables for variables and registers, annotated stack frames, and hex dumps for memory — directly in the chat panel.
GDB commands
@cfs-debug gdb: backtrace
@cfs-debug info registers
@cfs-debug info locals
@cfs-debug print myVariable
@cfs-debug run gdb command: info locals
Note
Destructive GDB commands (quit, kill, detach, file, target) are blocked by the assistant. All other GDB commands are passed through to the active debug session.
AI analysis
@cfs-debug what caused this hard fault?
@cfs-debug find bugs
@cfs-debug why is this variable null?
@cfs-debug explain the current stack trace
For analysis questions, the assistant gathers context from the live debug session — registers, local variables, stack frames — and constructs a prompt for GitHub Copilot, returning an explanation grounded in the actual hardware state.
Real-world examples
Example 1: Analyzing firmware size
Before a release, you need to reduce flash usage. In Claude Code:
"Analyze the firmware binary and show me the largest consumers of flash and RAM."
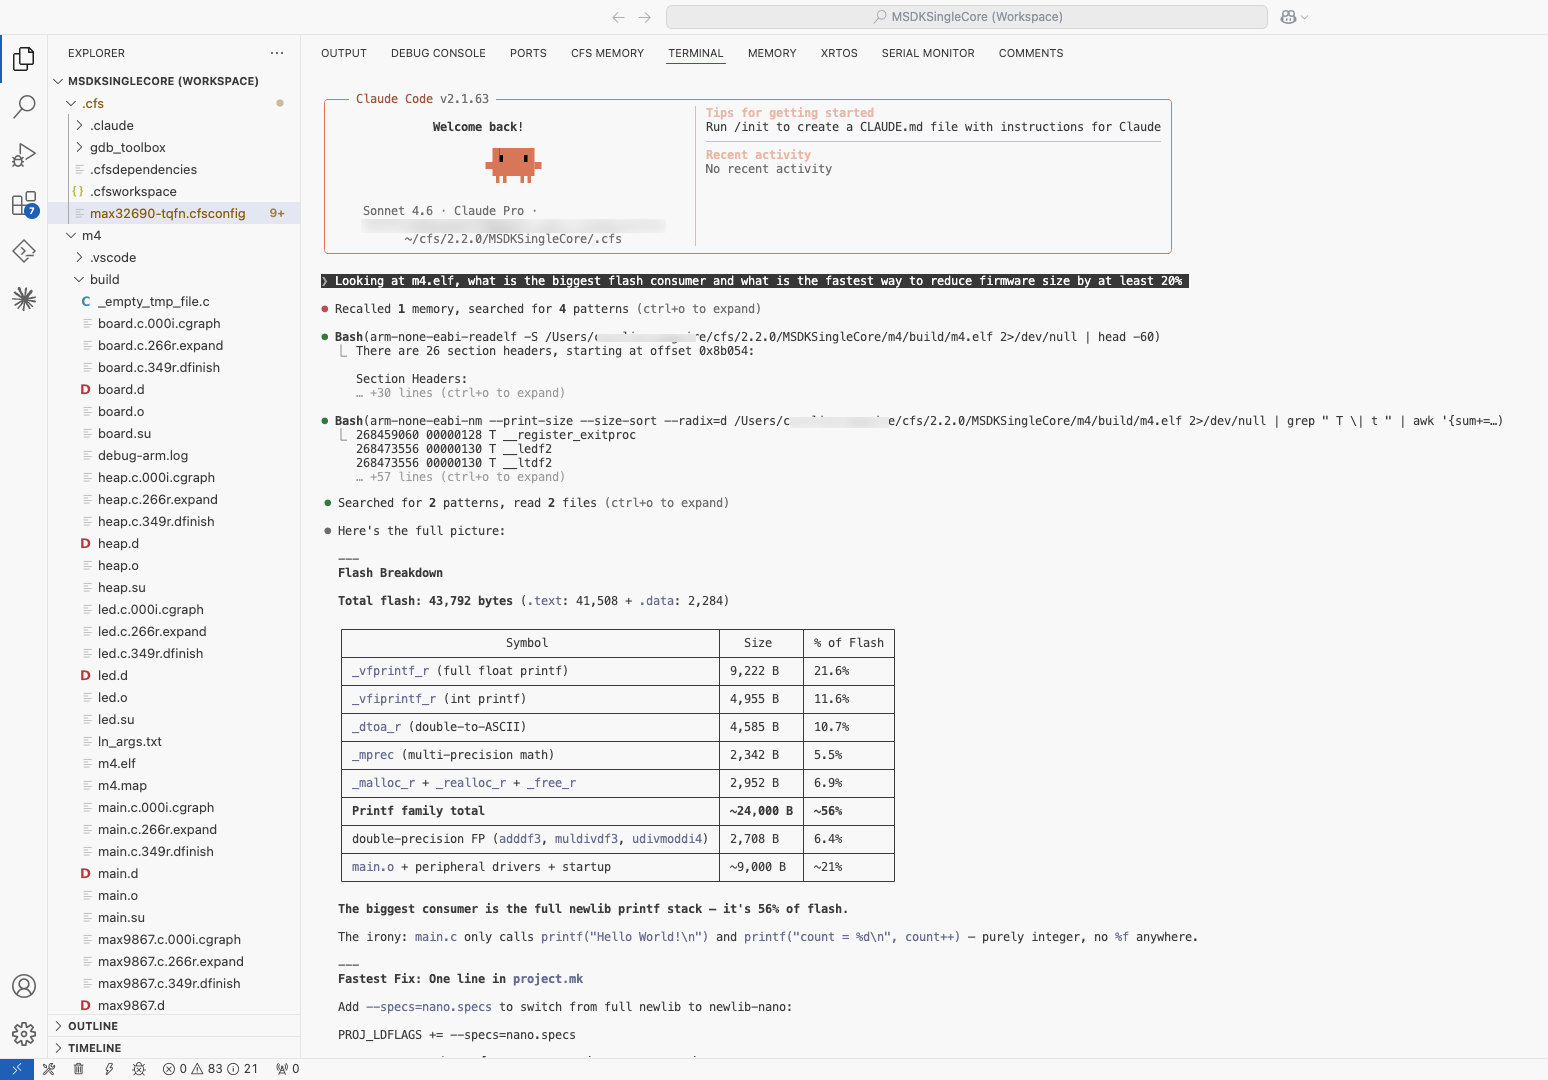
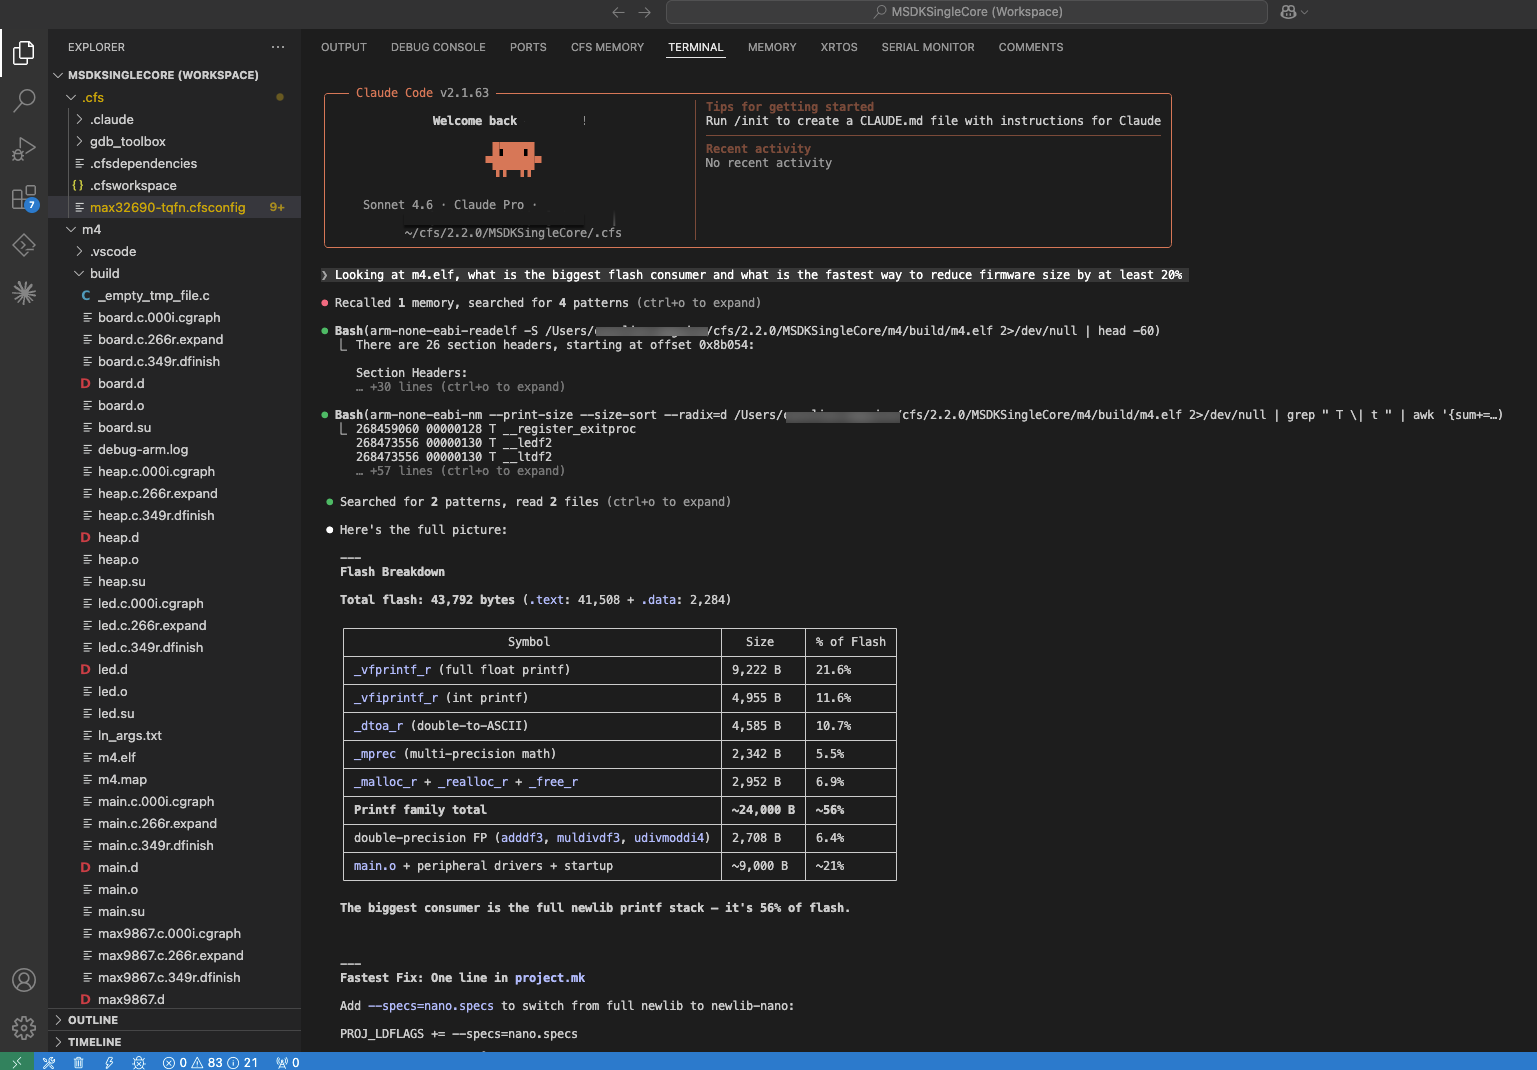
The assistant reads the ELF binary, surfaces symbol sizes and section layout, ranks the largest contributors, and suggests candidates for optimization — without requiring you to manually run arm-none-eabi-nm and sort the output yourself.
Example 2: Diagnosing a hard fault
Your firmware hits a hard fault and you're not sure why. In Agent Mode or Claude Code:
"What caused this hard fault?"
The AI Debug Assistant:
- Reads the ARM Cortex-M fault status registers (CFSR, HFSR, BFAR, MMFAR)
- Decodes the exception type — bus fault, memory management fault, usage fault, or hard fault
- Inspects the faulting address against the memory map
- Walks the call stack to identify the offending function and source line
- Reports the root cause in plain language with the relevant file and line number
This is the same systematic sequence an experienced embedded engineer would follow — except the AI completes it in seconds.
Example 3: Tracking a multi-core shared memory race condition
You're developing firmware for a dual-core SoC — a Cortex-M33 handling real-time sensor acquisition and a Cortex-M4 running application logic — sharing a region of SRAM. Under load, the application core intermittently reads stale values from the shared buffer. There's no crash, no fault — just wrong data.
In Agent Mode or Claude Code:
"Investigate the shared memory issue between both cores."
The AI Debug Assistant:
- Connects to debug sessions on both cores
- Reads the relevant memory region and inspects variables mapped there from the ELF symbol table
- Examines the execution state of each core — what each was running, what addresses each was accessing
- Identifies that the DMA transfer on Core 1 overlaps with Core 0's read of the same descriptor with no synchronization primitive guarding access
- Reports the specific memory region, the conflicting accesses, the source lines involved, and a suggested fix
This kind of multi-core investigation — correlating state across debug sessions to find a subtle data-sharing issue — traditionally consumes hours of manual register inspection and instrumented rebuilds.
Example 4: Tracking memory corruption with a watchpoint
A variable in your firmware is being corrupted and you don't know where. In Agent Mode or Claude Code:
"Watch shared_buffer for writes and tell me what's writing to it."
Using the autonomous-investigation prompt, the AI Debug Assistant:
- Locates the variable in the ELF symbol table to get its address
- Sets a hardware watchpoint on that address
- Continues execution and waits for the watchpoint to fire
- Reads the call stack at the point of the write
- Disassembles the surrounding code to identify the root cause
- Reports the offending function, source line, and what value was written
Pre-built diagnostic prompts
The AI Debug Assistant includes a library of pre-built diagnostic prompts — structured investigation sequences that encode the kind of expertise that typically takes years of embedded development to build. When you invoke a prompt, the AI follows a systematic, repeatable sequence rather than guessing.
See the Tools and workflows reference for the full list of available prompts and how to invoke them.
Next steps
- Tools and workflows reference — full reference for all debug tools and diagnostic prompts
- Troubleshooting — troubleshooting guidance for common AI Debug Assistant issues
- GDB Toolbox — automate GDB command sequences with JSON-based scripts
- Debug a multicore application — set up multi-core debug sessions