Resource Profiling report
The Resource Profiling report provides resource and performance estimates for your model on the target hardware.
Before you start
This section assumes you have already generated a Resource Profiling report from the System Planner UI in Embedded AI Tools. The report is an interactive, graphical report with filtering and recommendations panels.

Tip
To generate output for scripting and automation, use cfsutil ai profile from the terminal to create text or JSON reports.
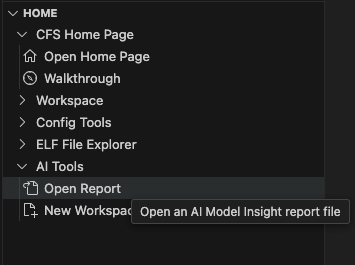
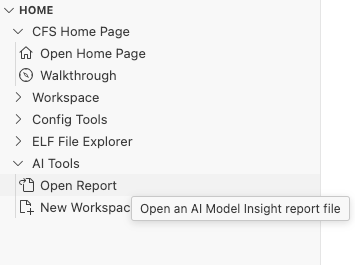
To reopen a previously generated report, select AI Tools > Open Report from the Home section of the CFS sidebar.
Model performance overview
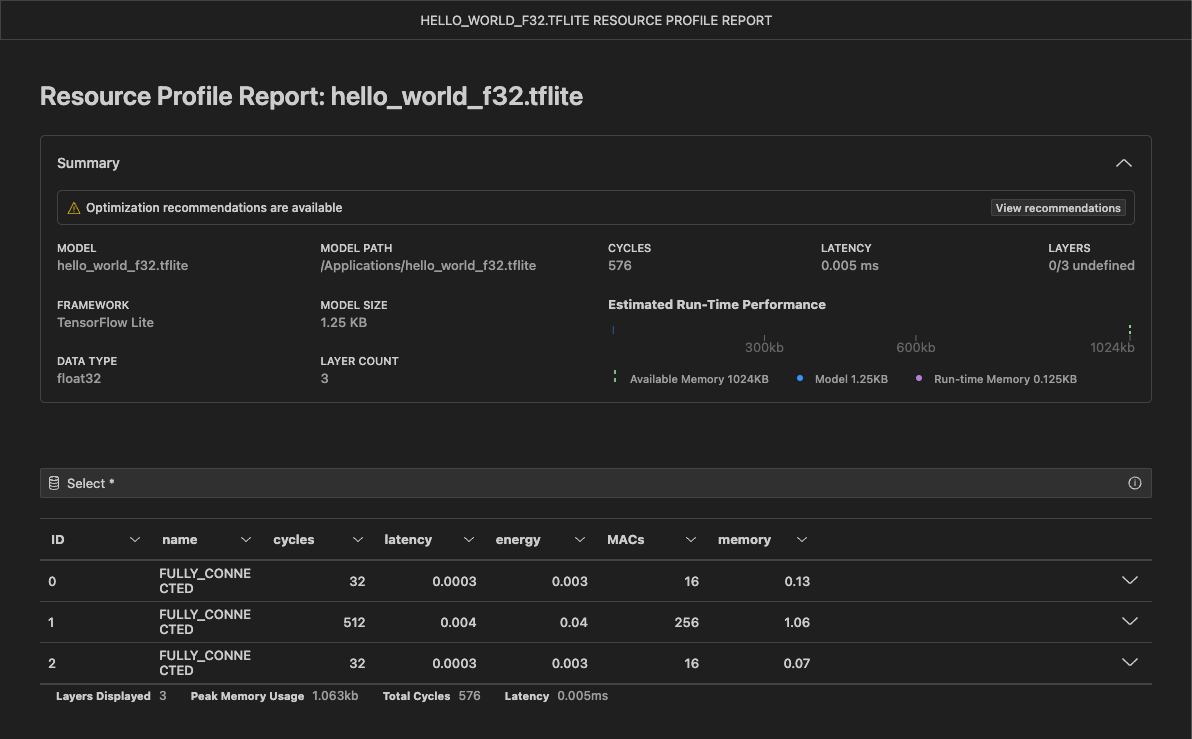
The Summary section provides high‑level information about the model file and its expected run‑time performance on the target hardware.
Tip
When optimization recommendations are available, a banner appears at the top of this section. Click View recommendations to open the side panel containing memory recommendations, layer optimization opportunities, and MACs optimization opportunities.
| Field | Description |
|---|---|
| MODEL | Filename of the model under test. |
| MODEL PATH | Path to the model file on disk. |
| CYCLES | Estimated compute cycles required to execute the model. |
| LATENCY | End-to-end inference time in milliseconds, derived from cycles and max CPU clock frequency. |
| LAYERS | Count of accelerated layers out of total layers on the selected target. |
| FRAMEWORK | ML framework type. Currently only TensorFlow Lite is supported. |
| MODEL SIZE | Memory required to store the model (in KB). |
| DATA TYPE | Numerical precision defined in the model file. |
| LAYER COUNT | Total number of layers in the model. |
| Estimated Run-Time Performance | Visual graph showing available memory, model size, and run-time memory usage. |
Optimization recommendations
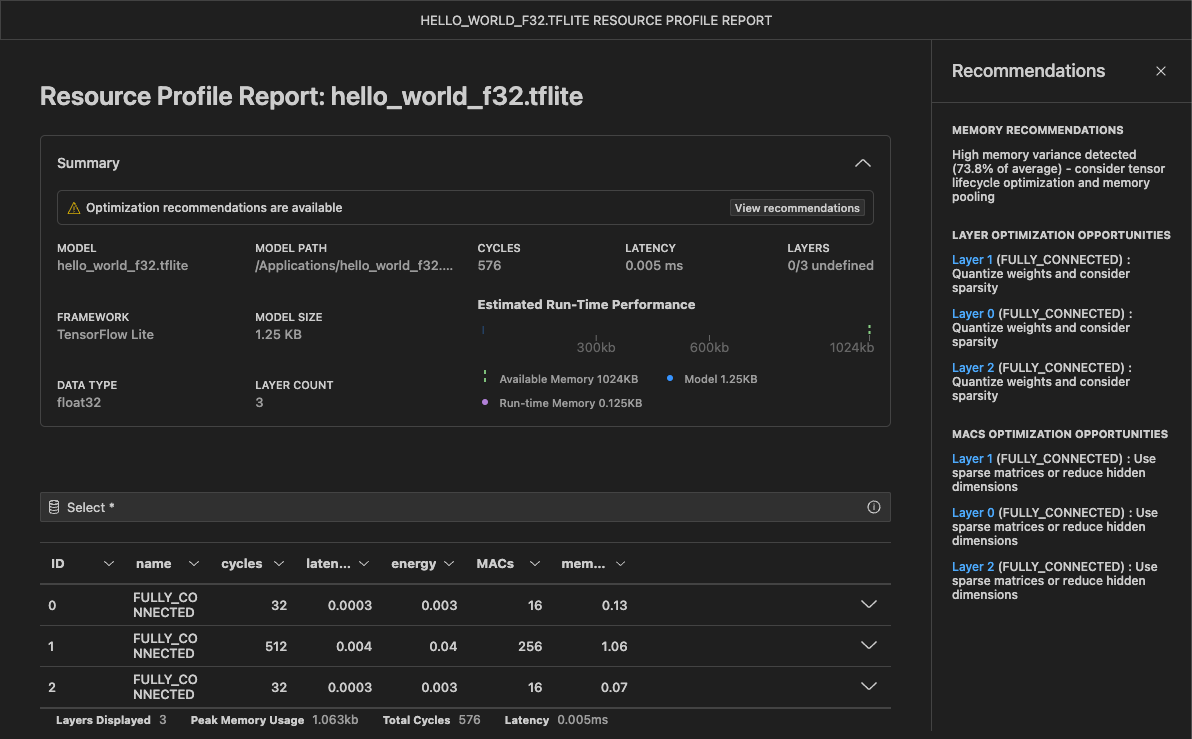
When optimization opportunities exist, the Recommendations panel presents model-level and layer-specific guidance to reduce memory usage and computational cost. Recommendations are grouped into memory, layer, and MACs optimization categories.

Memory recommendations
This section provides model-level insights related to memory usage patterns observed during analysis. For example, high memory variance across layers may indicate inefficient tensor lifecycles or excessive intermediate allocations. In such cases, the panel suggests techniques such as tensor lifecycle optimization or memory pooling to improve memory stability and reduce peak usage.
Layerwise memory optimization opportunities
This section highlights individual layers that are most likely to benefit from parameter-level optimizations. Layers are listed by index and operator type, along with targeted suggestions such as quantizing weights or introducing sparsity.
MACs optimization opportunities
This section identifies layers with high multiply–accumulate counts (MACs), which often dominate the overall compute cost. For each flagged layer, the panel suggests strategies to reduce computation, such as using sparse matrices or reducing hidden dimensions.
Interpreting optimization opportunities
Layer and MACs optimization opportunities include the following information:
- Layer: Index of the layer in the model (for example:
0,1,2). Click each layer to view it in the Model Layers table. - Operator: The operator used by the layer.
- Suggestion: A targeted optimization hint based on the layer’s characteristics and observed cost.
When you select a layer, the Model Layers table is filtered to show the corresponding layer. A summary below the table updates to reflect metrics for the currently displayed layers, including peak memory usage, total cycles, and estimated latency.
Detailed layer metrics
The Model Layers table lists every layer in the model along with its performance and resource metrics. It provides a detailed view for identifying performance bottlenecks.
Each row can be expanded to show additional layer details by clicking the chevron icon on the right.
| Field | Description |
|---|---|
| ID | Index of the layer in the model (for example: 0, 1, 2). Matches the parser output. |
| name | Layer name as parsed from the model (for example: conv_1, dense_2). |
| cycles | Total compute cycles required to execute the layer. |
| latency | Estimated runtime of the layer in milliseconds. |
| energy | Estimated energy consumption of the layer in microjoules (µJ). |
| MACs | Number of multiply–accumulate operations performed by the layer. |
| memory | Memory footprint of the layer in KB. |
Filtering and querying layer metrics
The Model Layers table can be filtered using SQL like queries.
Most valid SQL constructs are supported, including WHERE, ORDER BY, LIMIT, LIKE and REGEXP.
Note
FROM is not supported.
| Filter | Query |
|---|---|
| Select specific columns | SELECT name, latency |
| Layers with cycles > 100 | SELECT * WHERE cycles > 100 |
| Top 10 slowest layers | SELECT ID, name, latency ORDER BY latency DESC LIMIT 10 |
| Layers with MACs in a range | SELECT * WHERE MACs BETWEEN 100000 AND 500000 |
| Layer name contains “CONNECT” | SELECT * WHERE name LIKE '%CONNECT%' |
| Layer name starts with “FULLY” | SELECT * WHERE name REGEXP '^FULLY.*' |
Next steps
Apply optimizations such as quantization or restructuring memory-intensive layers (as advised in the report), then re-run the analysis to confirm improved efficiency and compatibility with your hardware.