Memory Viewer
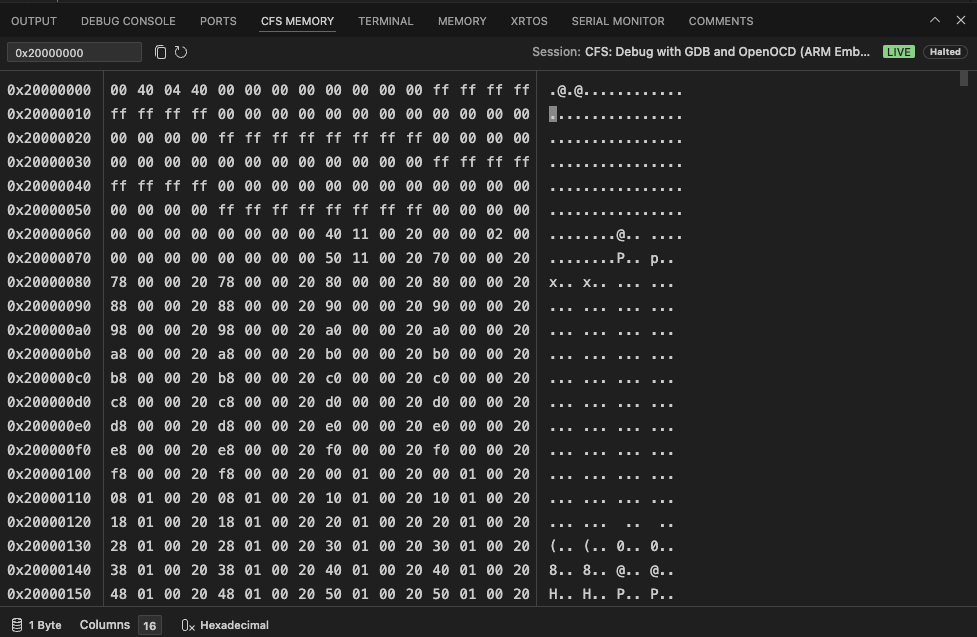
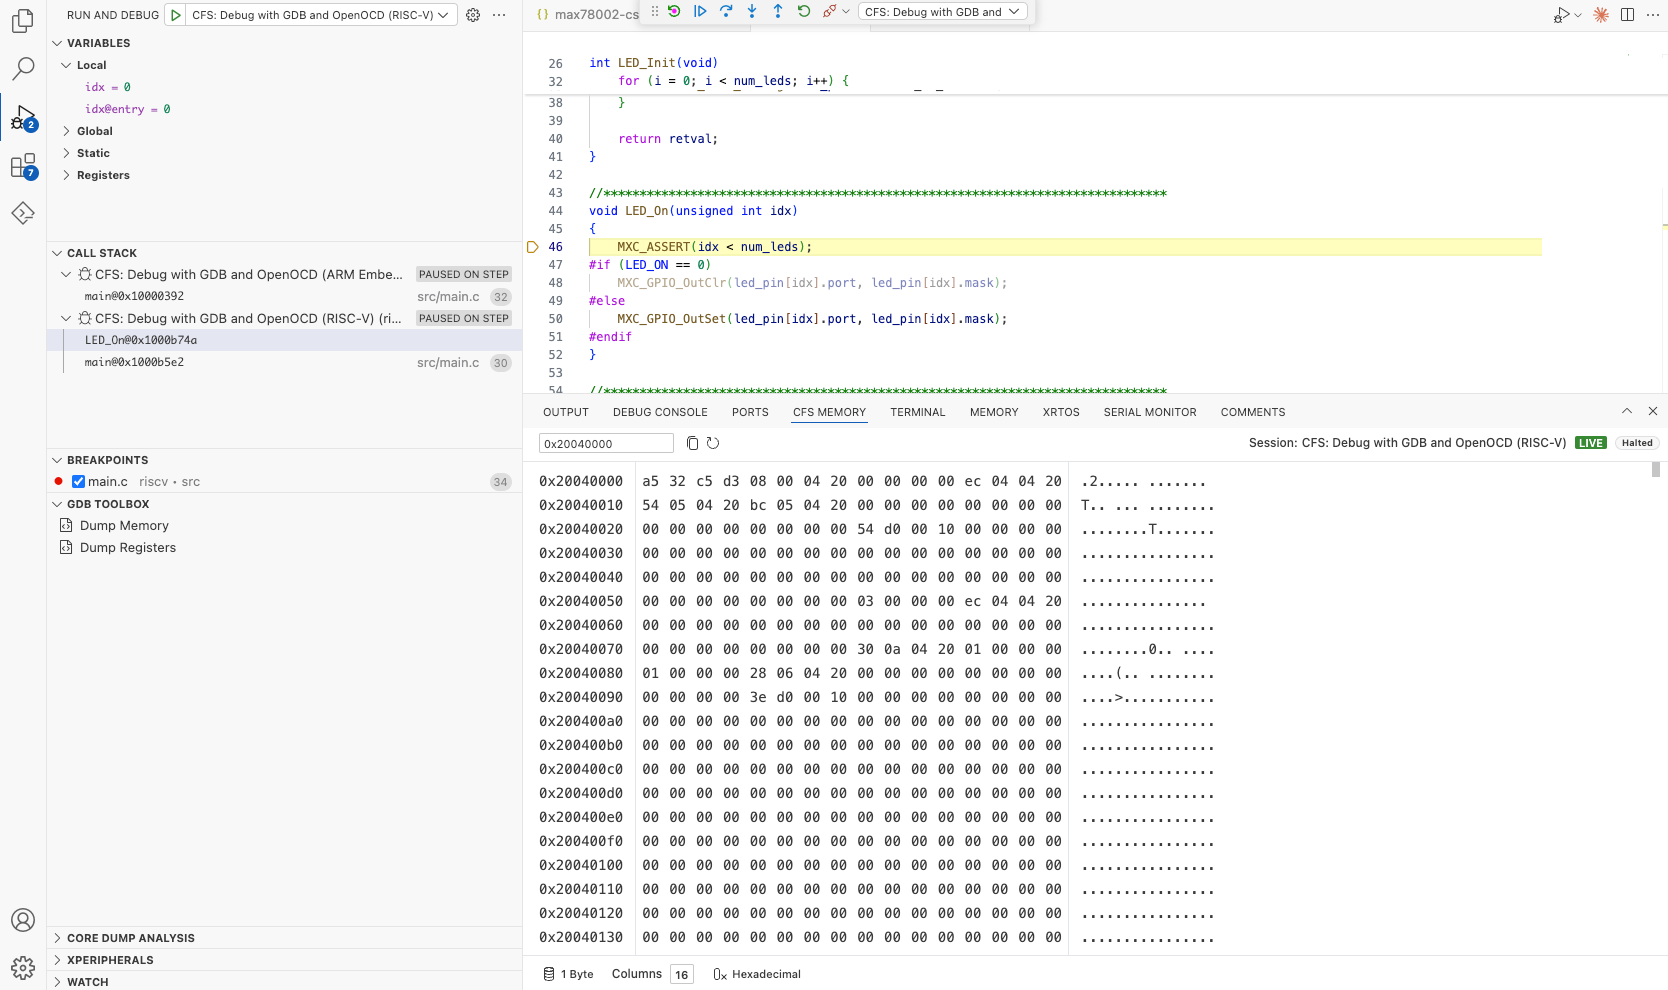
The Memory Viewer lets you inspect device memory during live and retrospective debug sessions. It is a multi-core-aware, CFS-native tool that integrates directly with the CodeFusion Studio debug infrastructure and replaces the Memory Viewer bundled with Cortex-Debug.
It has three main areas:
- Toolbar — address navigation, copy, refresh, and session status
- Memory grid — scrollable hex and ASCII display
- Footer — display settings

Open the Memory Viewer
The Memory Viewer is available as the CFS Memory tab in the bottom panel. It appears alongside the Terminal, Debug Console, and other panel views.
To open the panel, start a debug session. The CFS Memory tab appears in the bottom panel automatically.
You can also open it at any time from the Command Palette: press Ctrl+Shift+P (Windows/Linux) or Cmd+Shift+P (macOS) and run CFS Memory: Focus on CFS Memory Viewer View.
Navigate to an address or symbol
Use the Go to field in the toolbar to jump to a specific memory location.
- In the Go to field, enter one of the following:
- A hexadecimal address (for example,
0x20000000) - A decimal address (for example,
536870912) - A symbol name (for example,
count)
- A hexadecimal address (for example,
- Press Enter.
For hex and decimal addresses, if the address is already within the loaded region, the grid scrolls to it without fetching new data. Otherwise, the memory grid loads data starting from that address.
For symbol names, the viewer resolves the symbol to a memory address using a halted debug session and then loads memory at that address. In a multi-core environment, it uses the halted debug session selected in the Call Stack view, or falls back to the first available halted session.
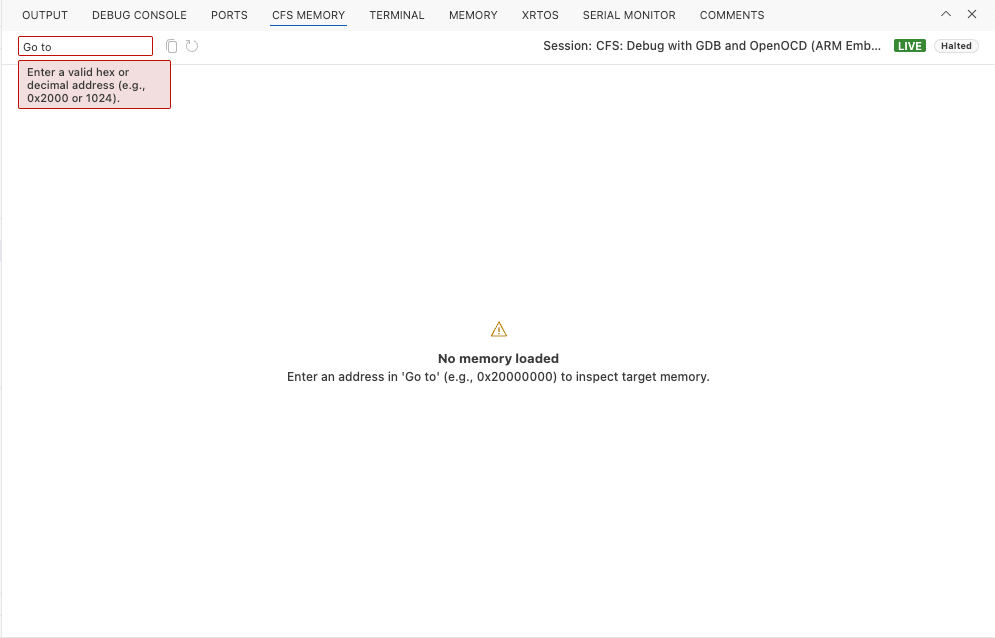
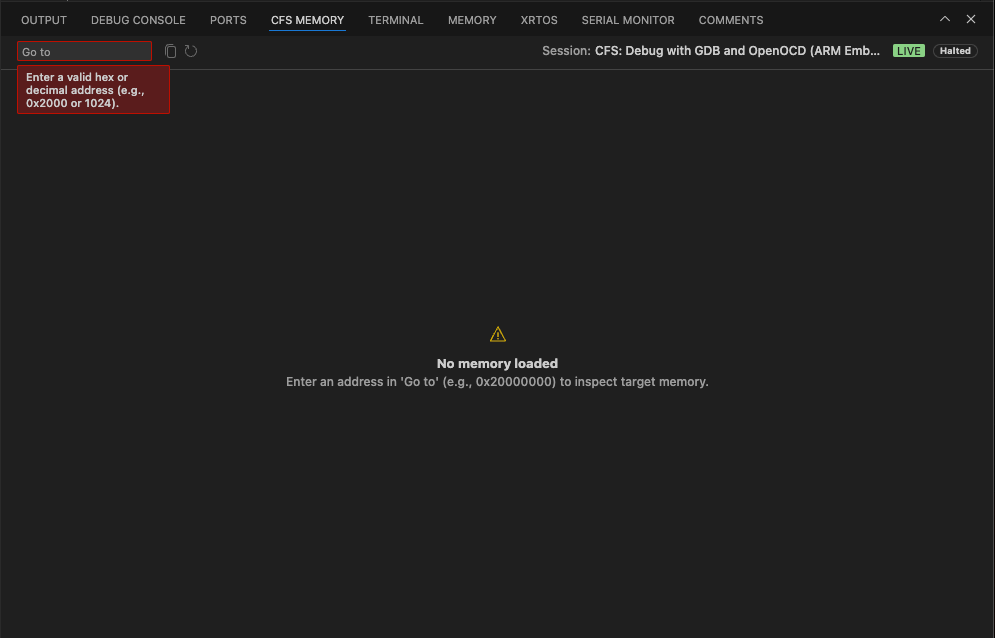
If the input cannot be resolved or the session is not in a state that allows a read, the Go to field shows an inline error:
| Error | Message |
|---|---|
| Invalid address | Enter a valid hex or decimal address (e.g., 0x2000 or 1024). |
| Symbol not found | Could not find symbol in the current context. |
| Symbol lookup timed out | Symbol query timed out. |
| No active session | No active debug session. Start a debug session to view memory. |
| Target running | Target not halted / Cannot execute this command while the target is running. |
| Read in progress | Already reading memory data. Please wait. |
Read memory
The memory grid displays memory as a scrollable table with three columns:
- Address — the memory address of the first byte in each row, displayed in hexadecimal
- Hex values — the byte values in the selected display format, grouped according to the byte grouping setting
- ASCII — a printable ASCII representation of the same bytes; non-printable characters appear as
.
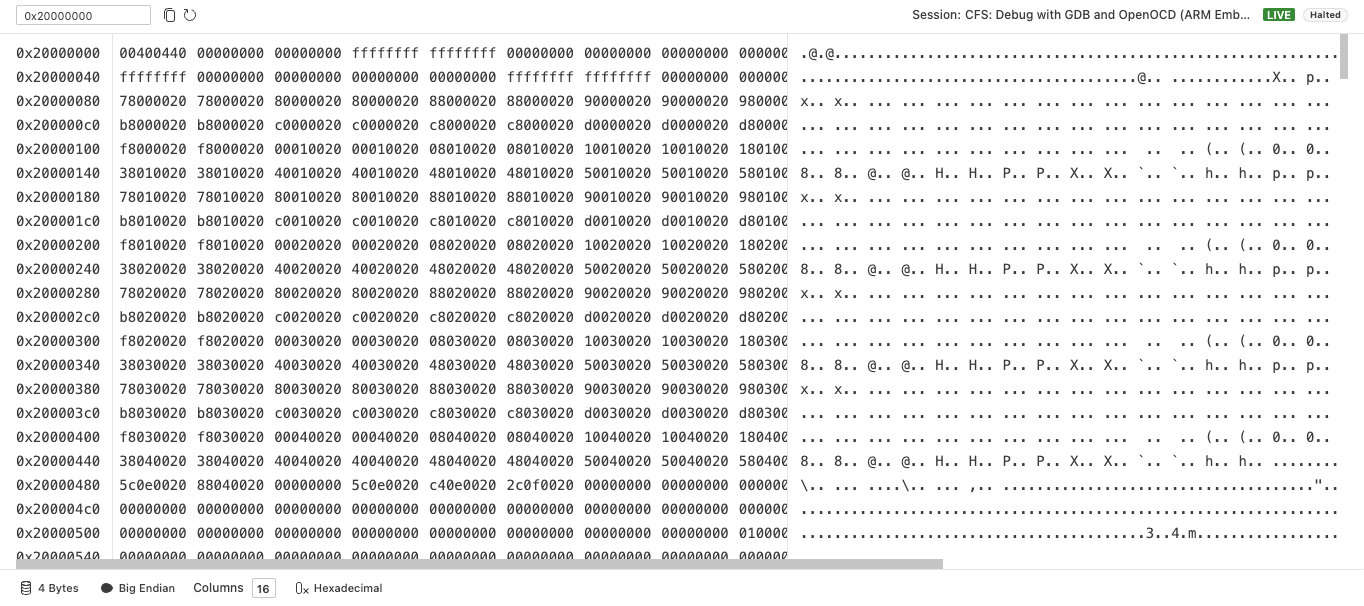
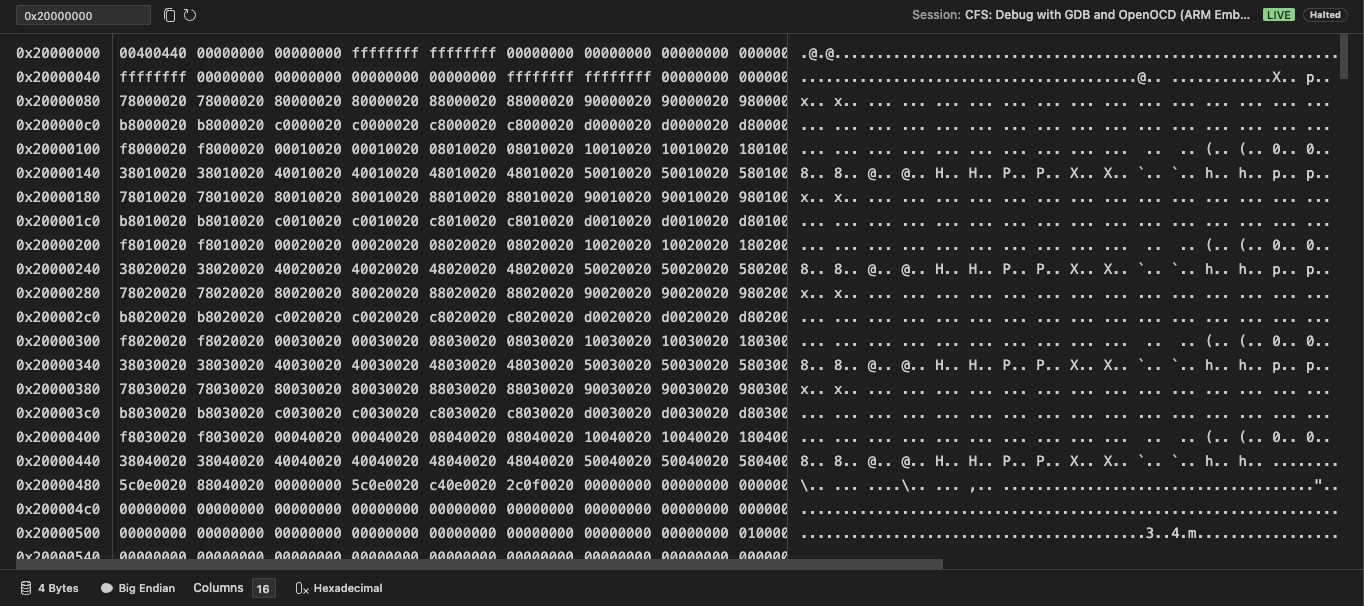
Use the display settings in the footer to adjust how the grid presents data — switch between hexadecimal and decimal, change the number of columns, or group bytes together to get a layout that suits your needs.
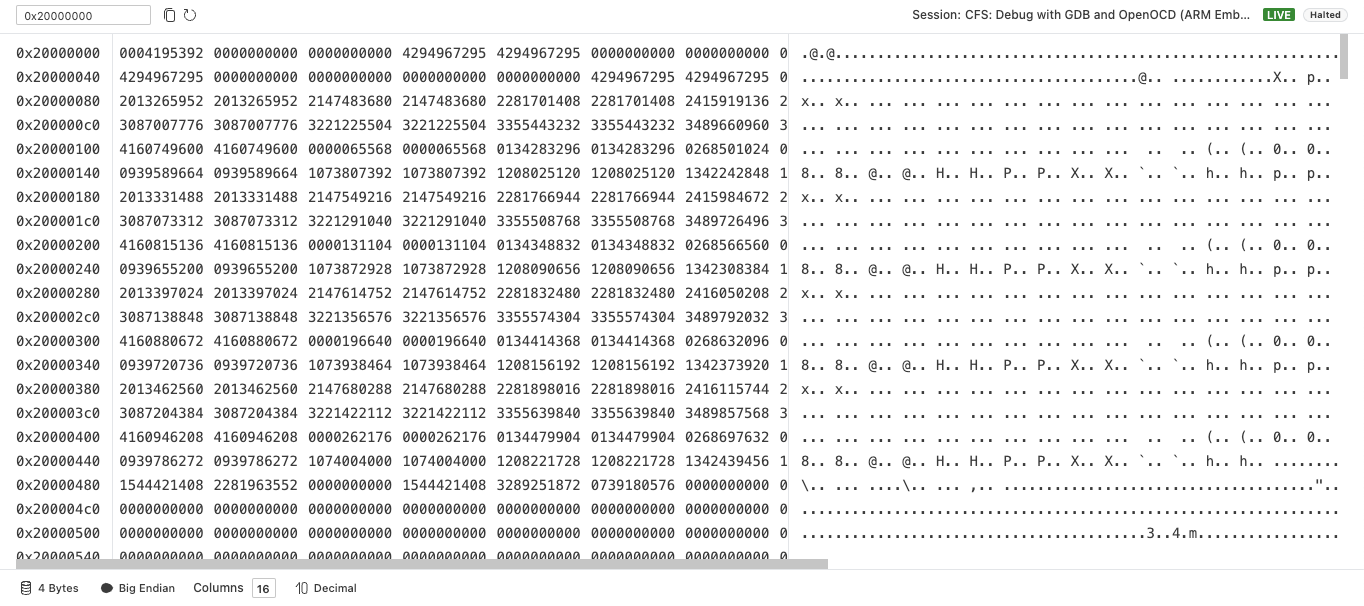
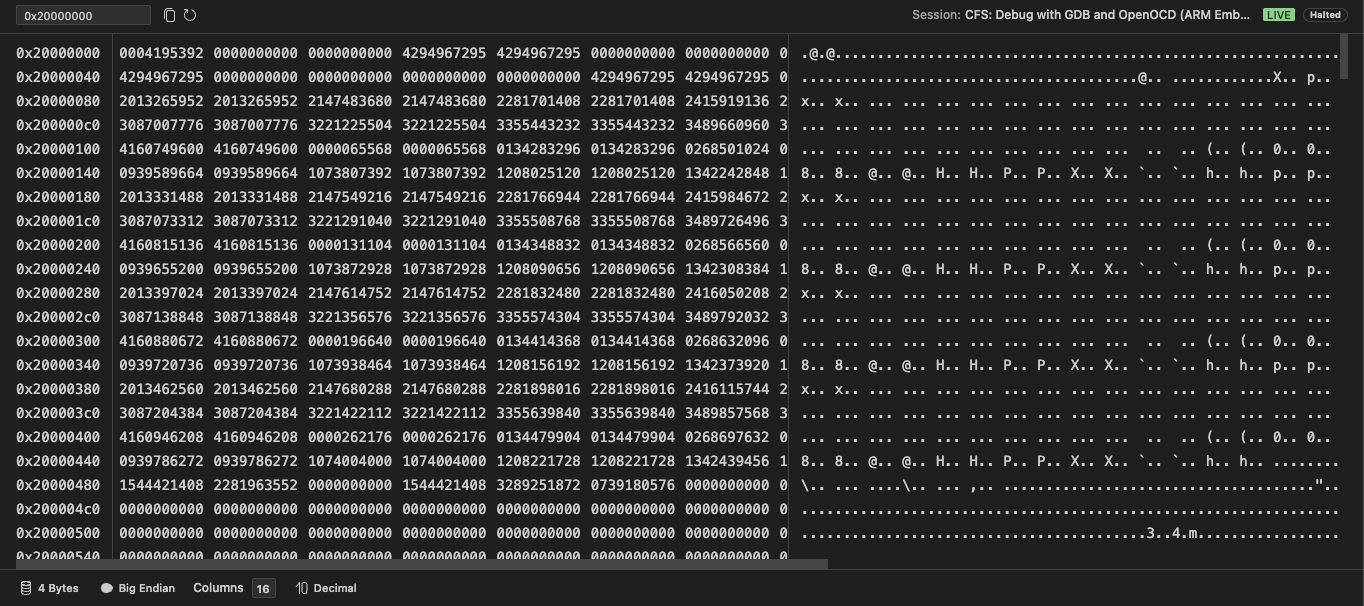
The grid uses infinite scroll. As you scroll toward the end of the loaded region, the viewer fetches the next chunk of memory from the debug adapter automatically.
Copy memory
To copy the contents of the memory grid:
- Select a region of text in the grid.
- Click the Copy

 button in the toolbar, or use your system copy shortcut.
The viewer strips leading and trailing whitespace and line breaks from the copied text, so the result is a single contiguous string of hex or ASCII characters.
The Copy and Refresh 
 buttons are both disabled when no memory data is loaded.
Refresh memory
Auto-refresh
Once you have navigated to an address, the viewer automatically re-reads memory at that address each time the debugger halts. This means you do not need to manually refresh between steps or breakpoints, the grid updates silently whenever execution stops.
When a session resumes (continues), the viewer marks the current data as stale to indicate the values may no longer reflect the target state.
Example: watching a variable update in memory
A practical way to see auto-refresh in action is to watch a variable change value as you step through code.
Declare a static variable in your source so the compiler gives it a fixed address in SRAM:
static int count = 0;
Then, once your debug session is halted at a breakpoint:
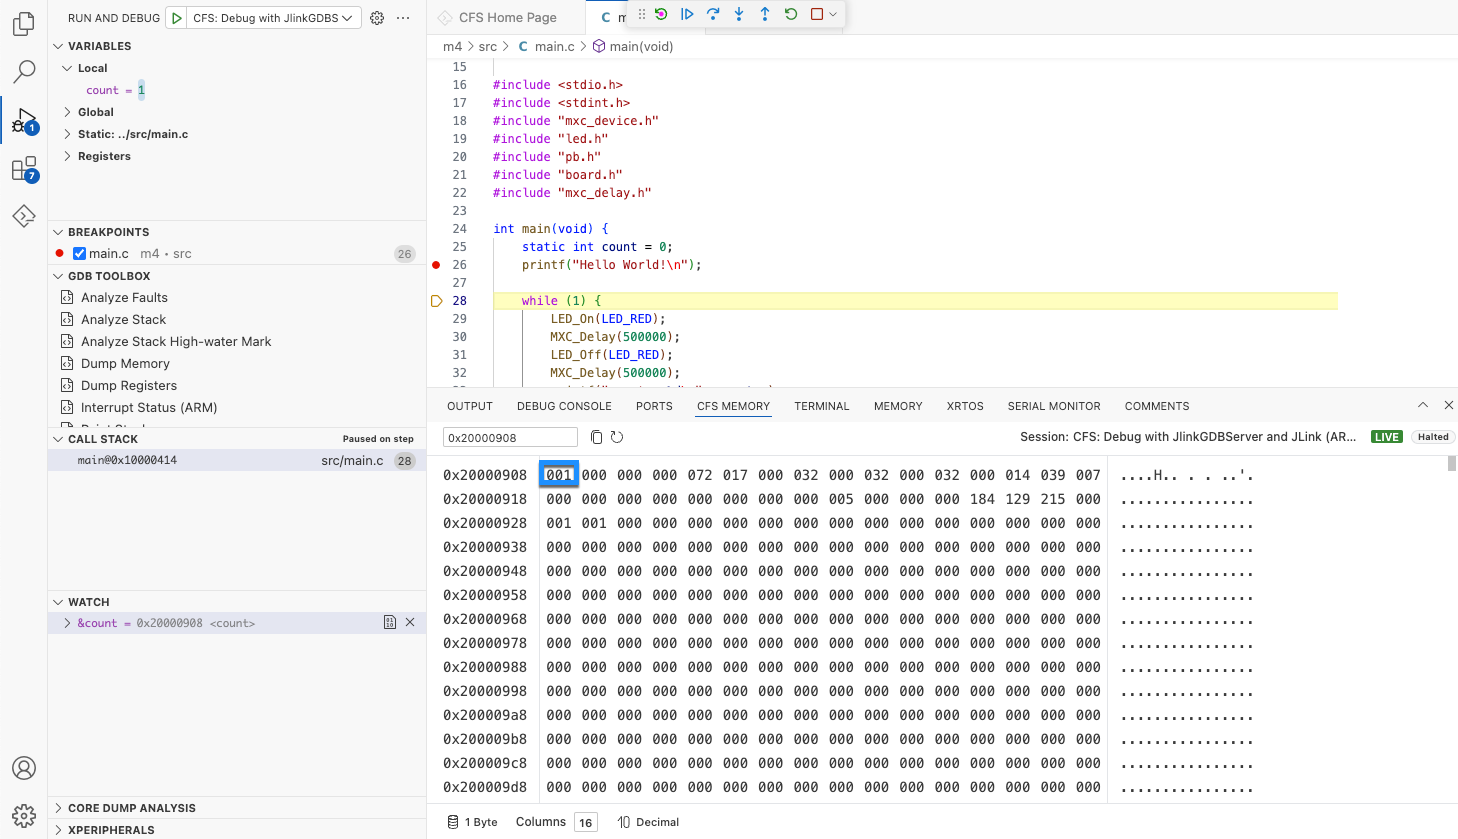
- In the Go to field in the Memory Viewer, enter the symbol name
countdirectly, or get its address by adding&countas a Watch expression in the debug sidebar or runningprint &countin the Debug Console and entering the address instead. Press Enter. - Set the footer to 1 Byte grouping and Decimal display for easier reading.
- Press F10 (Step Over) in the debug toolbar to advance one line at a time without descending into library function calls.
Each time execution halts, the Memory Viewer re-reads the address automatically. You can watch the bytes at count's address change as the value increments — without pressing Refresh manually.

Manual refresh
If you need to re-read memory while already halted (for example, after writing a value directly from the Debug Console), click the Refresh button in the toolbar. The button is disabled unless a session is halted and an address has been entered.
Display settings
The footer contains controls for adjusting how memory is formatted and laid out.


Byte grouping
Select the byte grouping label (for example, 1 Byte) in the footer to cycle through grouping sizes: 1 Byte, 2 Bytes, 4 Bytes. The grouping determines how many bytes are combined into a single hex cell.
Combined with the column count, byte grouping controls how many bytes appear per row. For example, 2 Bytes grouping with 8 columns displays 16 bytes per row.
Endianness
When byte grouping is set to 2 Bytes or 4 Bytes, an endianness control appears next to the byte grouping label. Click it to toggle between Big Endian and Little Endian. The endianness control is hidden when byte grouping is set to 1 Byte.
Columns
Select the Columns dropdown to set the number of hex cells per row. Available options are 4, 8, 16 (default), 32, or 64.
Display format
Click the display format label (for example, Hexadecimal) to toggle between Hexadecimal and Decimal display of byte values.
Session status
The toolbar displays status information for the active debug session when one is present:
- Session name — the name of the currently active debug session
- LIVE

 or POST-MORTEM

 — whether the session is connected to a running target or reading from a core dump
- Halted

 or Stale

 — whether the target is currently stopped (data is current) or running (data may be out of date)
Retrospective debugging
The Memory Viewer supports retrospective debugging sessions that read from a core dump file rather than a live target. These sessions are indicated by the POST-MORTEM badge in the toolbar. The viewer operates in read-only mode during retrospective sessions.
To set up a retrospective session, see Core Dump Analysis. Once the session is open, enter a memory address in the Go to field as you would in a live session.
Empty states
When memory cannot be displayed, the viewer shows a message explaining why:
| State | Title | Description |
|---|---|---|
| No debug session | No active debug session | Start a debug session to view memory. |
| Target running | Execution is running | Halt execution to read memory. Memory can only be read when the target is halted. |
| No address entered | No memory loaded | Enter an address in 'Go to' (e.g., 0x20000000) to inspect target memory. |
Multi-core support
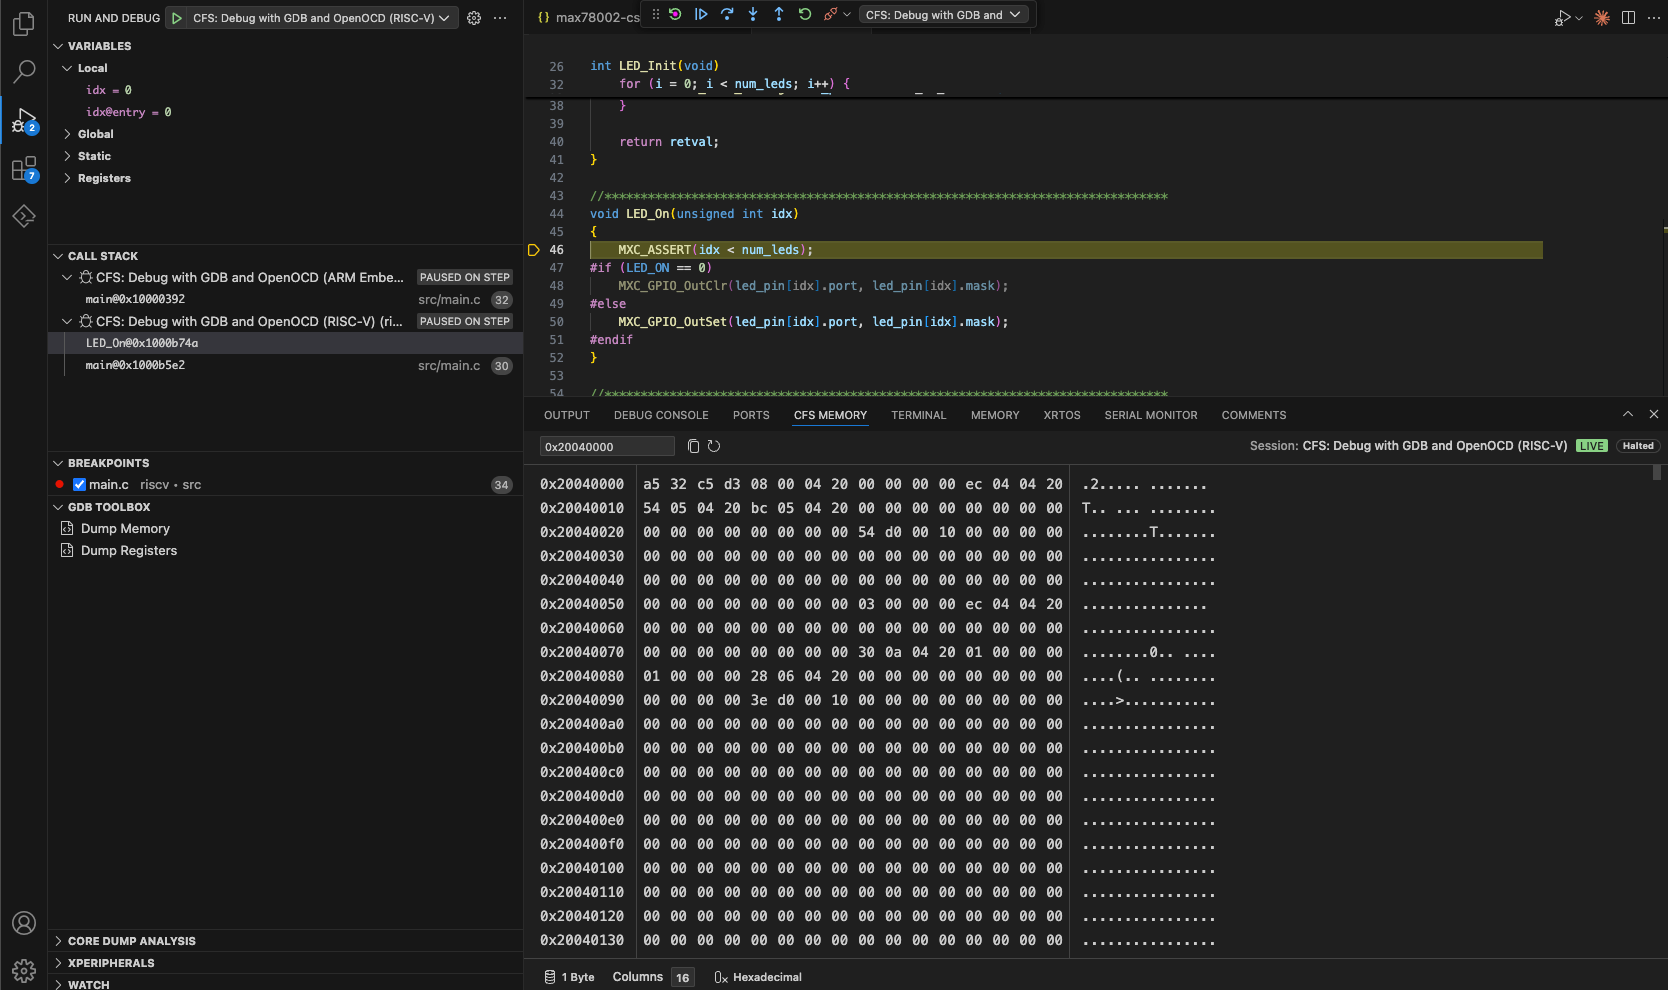
The Memory Viewer tracks all active debug sessions simultaneously. In a multi-core environment, it displays memory for the session you select in the call stack view and updates automatically when you switch between sessions.
When you switch context, the viewer:
- Identifies the newly active session.
- If that session is halted, fetches memory at the last requested address.
- If that session is running, marks the current data as stale.
Each session's lifecycle (start, halt, continue, and stop) is tracked independently, so switching between cores does not disrupt memory data from other sessions.
Error handling
The Memory Viewer handles debug adapter and transport errors without blocking your workflow:
- Unmapped addresses: If you navigate to an address that cannot be read, the viewer shows an error message:
Read memory error: Unable to read memory. - Read timeout: If a memory read does not complete within five seconds, the request is cancelled and an error is shown.
- Session disconnect: If the debug adapter disconnects or the session terminates, the viewer clears the memory data and updates the session list.
- Target running: The viewer does not issue read requests while the target is running — use Refresh after the target halts.