Debugging interface
When you debug an application in CodeFusion Studio, the interface builds on VS Code’s native Run and Debug view and adds additional embedded-focused tools.
This includes VS Code’s standard debugging features, such as execution controls, variable inspection, breakpoints, and call stack information, along with additional embedded-focused tools provided by CodeFusion Studio, such as the GDB Toolbox and Core Dump Analysis.
Before you start
- Launch a debug session. For instructions, see Debug an application.
- Ensure the application is paused. Most debugging views, such as Variables, Watch, Call Stack, and Breakpoints, only become available once execution is paused.


Variables
The variables view presents all of the variables visible to the current scope and file of debugging. They are split into different sections for ease of use, detailed below. Double clicking on a value allows you to edit the value, right clicking provides a menu of additional options.
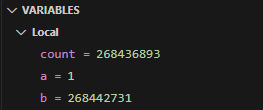
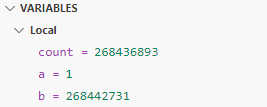
Local
Local variables are the variables in the current function scope.
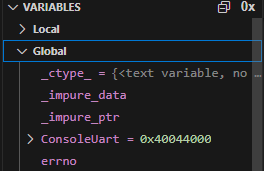
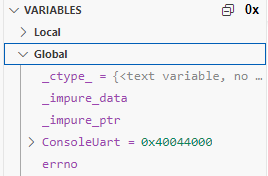
Global
Global variables are the variables in the global scope, visible to anywhere in the application.
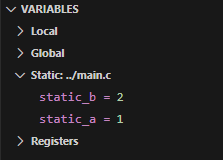
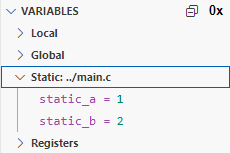
Static
Static variables are shown for the current file being viewed from the current PC or call stack selection.
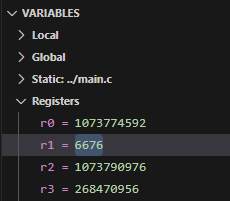
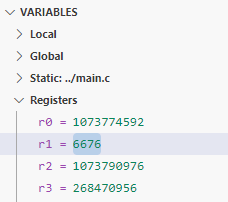
Registers
Registers provides a list of all of the core (non-memory-mapped) registers.
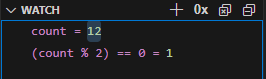
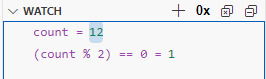
Watch
Allows you to set expressions which are evaluated. These can be simple variables or complex statements.
Warning
Expressions aren't context aware, so viewing a local variable from another context will fail to evaluate. Expressions can set variable values, which will happen each time the expression is evaluated (on step or pause).
Call stack
Displays the current call stack, with function name, PC address and source information where known. Selecting a function in the call stack will show the registers and local variables applicable to that function.


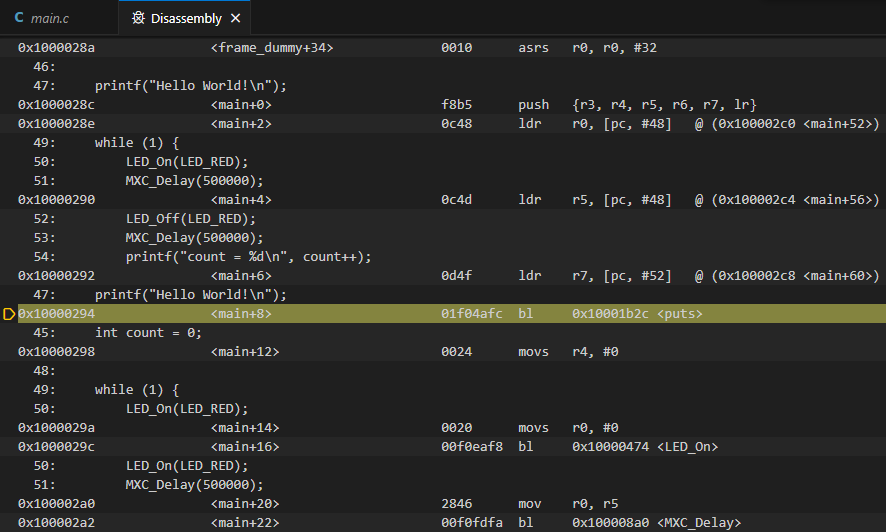
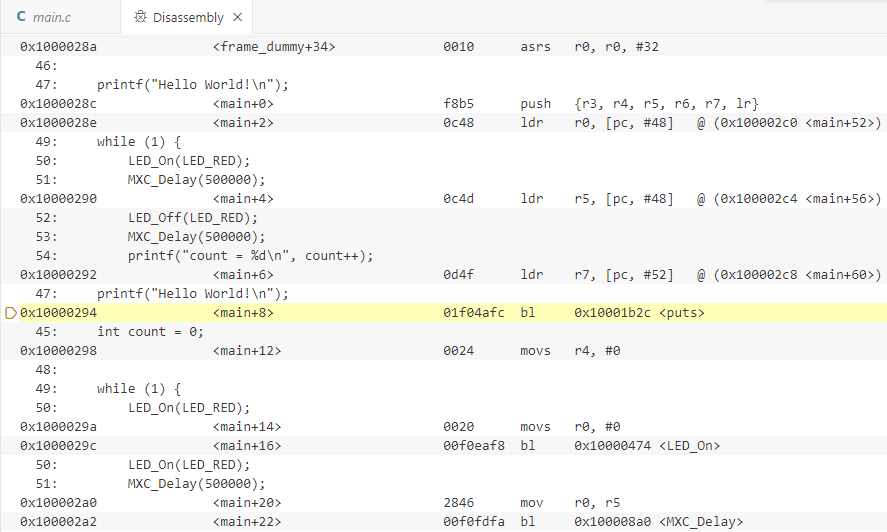
Disassembly view
Right-click on the main program being executed in the Call Stack view and select Open Disassembly View to view details of the machine-level instructions corresponding to the source code during a debugging session.
Note
Stepping while this view is in focus performs a single assembly instruction step.
Breakpoints
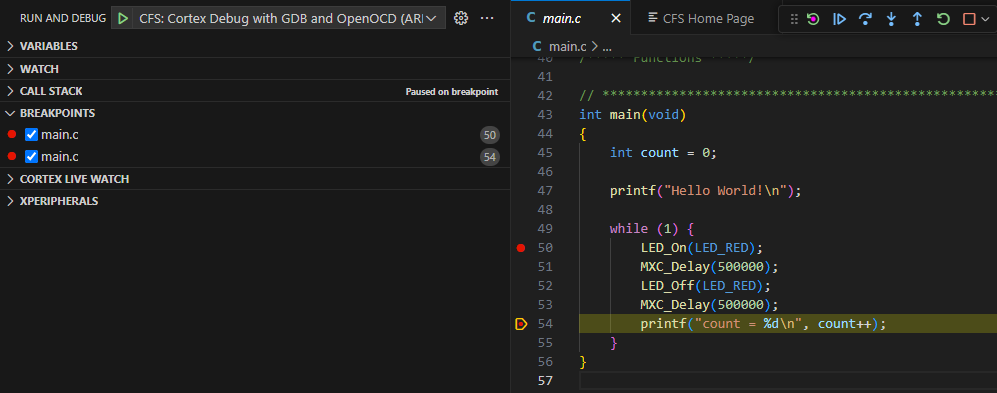
Breakpoints allow you to pause execution at a specific line of code and inspect program behavior.
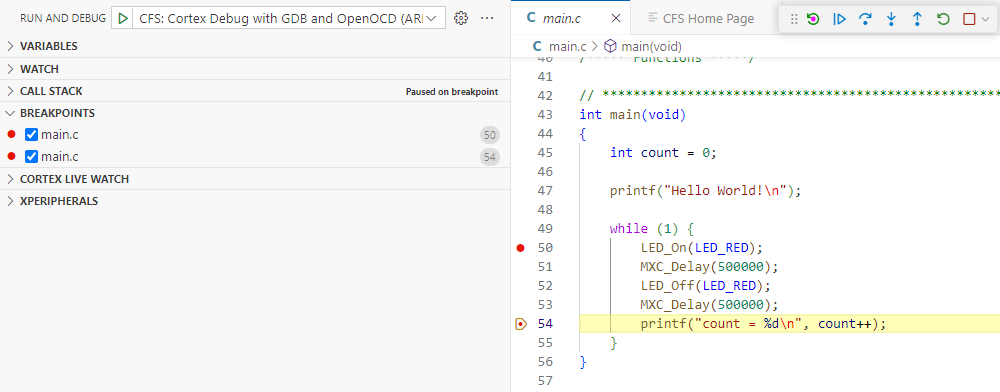
To view all set breakpoints, toggle them on/off, or add new ones, open the breakpoints view in the Run and Debug view.
Right-click on a breakpoint to access a list of available actions.
Line breakpoints
Line breakpoints pause execution at the beginning of a specific line in the source code, allowing you to inspect variables, step through execution, and debug effectively.
To set a breakpoint, click on the left margin of the editor next to the line number where you want to pause. A red dot will appear, indicating the breakpoint. Alternatively, right-click in the left margin and select Add breakpoint.
Conditional breakpoints
Conditional breakpoints allow execution to pause only when a specified condition is met. This is useful when debugging loops or tracking specific variable values.
To create a conditional breakpoint, right click on an existing breakpoint, select Edit breakpoint, choose Expression, and enter your condition.


Inline breakpoints
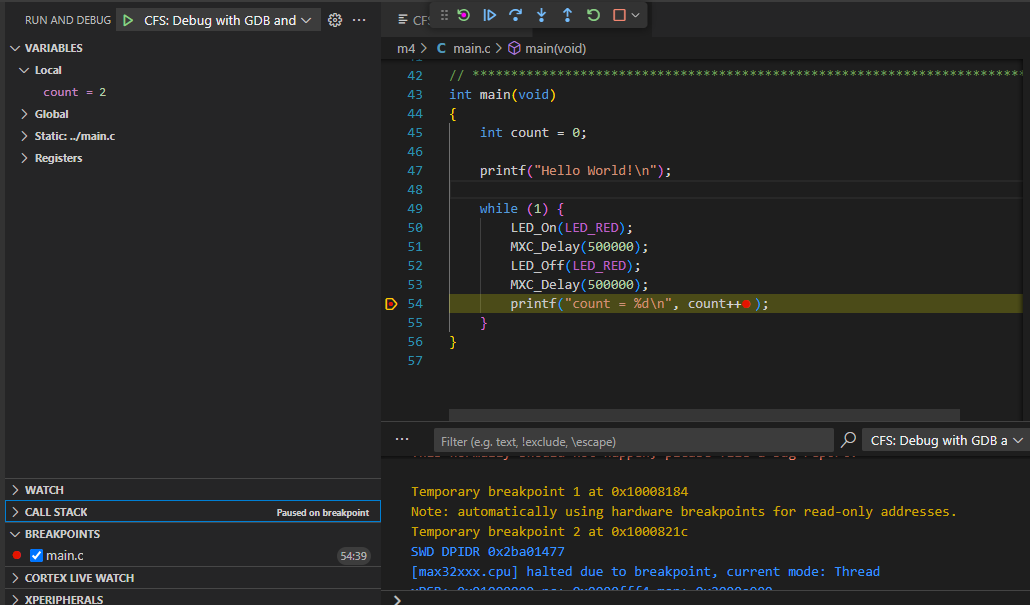
Inline breakpoints allow execution to stop inside specific expressions within a line of code, such as inside a loop or within method chains. They are useful when you need to debug a particular part of an expression rather than stopping at the start of the line.
To set an inline breakpoint:
- Click on the exact position where you want to place the inline breakpoint.
- Go to Run > New Breakpoint > Inline Breakpoint. You can also use the shortcut Shift + F9 (Windows/Linux) or Cmd + F9 (Mac).
- The inline breakpoint will now be set at the cursor position.

GDB Toolbox
The GDB Toolbox provides access to both built-in and user-defined JSON-based scripts that help inspect program state during a halted debug session. You can use it to create GDB scripts that log output, display messages, or save memory and register dumps.
For additional information, see GDB Toolbox.
Core Dump Analysis
The Core Dump Analysis Tool enables retrospective debugging for supported Zephyr-based projects, such as those running on the MAX32690. When a core dump is retrieved over JTAG (from flash) or UART (from serial log output), the tool displays the state of the program at the time of the crash, including active threads, stack usage, register values, and memory state. For additional information, see Core Dump Analysis.
CFS Memory Viewer
The CFS Memory Viewer is a multi-core-aware tool that lets you inspect device memory during live and retrospective debug sessions. It integrates directly with CFS debug infrastructure and provides a native alternative to the Cortex-Debug Memory tab. The viewer automatically re-reads memory each time the debugger halts, displays memory in a scrollable hex and ASCII grid, and supports configurable byte grouping, endianness, and display formats. For additional information, see Memory Viewer.
Peripheral registers
The XPeripherals view provides a nested structure of peripheral registers and user-modifiable bits. Hover over a register or bit to view more information, copy the value to the clipboard or modify the value.
Warning
Some bits are reserved and not provided in the list. When writing to an entire register, make sure reserved bits are not set.
GDB interface
You can interact directly with the debugger by entering GDB commands in the Debug Console.
- Start a debug session.
- In the toolbar above the terminal, select the Debug Console tab.
- Enter GDB commands at the prompt (
>), for exampleinfo registers


For additional information about GDB, refer to the GDB Basics.
Note
Many commonly used GDB commands, such as inspecting registers or dumping memory, are also available as preconfigured actions in the GDB Toolbox. For additional information, see GDB Toolbox
Memory
The Memory tab in the toolbar above the terminal shows the working memory. This displays a detailed image of what is currently being stored in memory as the program executes. This tab is provided by the Cortex-Debug extension. For an alternative with multi-core support and retrospective debugging, see CFS Memory Viewer.


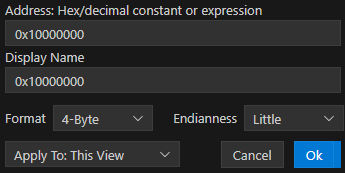
Customizing the memory view
To view a specific region of memory, click on the + icon and enter a memory address.
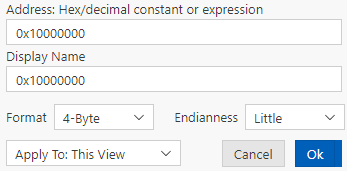
To customize that memory view, click on the pencil icon to edit the address, display name, width, and endianness:
Serial output
You can view UART serial output from the target using one of the following tools.
VS Code Serial Monitor
Warning
Arm CMSIS-DAP debuggers, including the MAXPICO and MAX32xxxx onboard debuggers, use the serial Break to trigger a target reset.
Microsoft's Serial Monitor in VS Code sends the Break before connecting to the serial port, which causes the processor to reset when using these debuggers. J-Link debuggers do not exhibit this behavior.
It is recommended to connect to the serial port before starting a debug session, or use an external serial terminal like Minicom or PuTTY.
Note
You need the Serial Monitor extension for VS Code to use this tool. You can install it from the VS Code marketplace.
- Click on Serial Monitor in the toolbar above the terminal.
- Set the Monitor Mode to Serial.
- Set the Port to the port in use by the hardware.
- Set the Baud rate to 115200
- Click Start Monitoring. This prints the outputs associated with the source code.
Info
To determine the correct port, view the available ports with the required port disconnected, connect the port and see which value appears in the dropdown list
Example
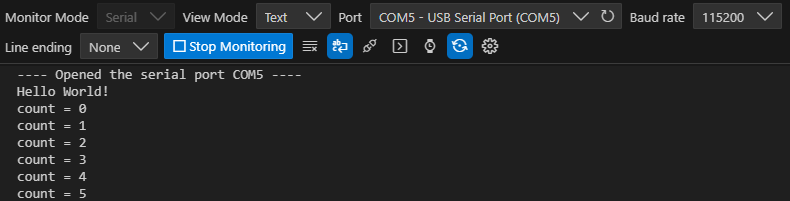
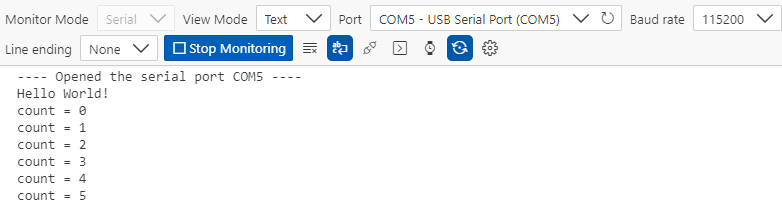
When using the example "Hello World" program, the output looks like this:
Tera Term
Tera Term is a free, open source terminal emulator commonly used to capture UART serial output from embedded systems. To capture UART output in Tera Term:
- Install Tera Term.
- Launch Tera Term and select the correct COM port (such as COM5).
- Go to Setup > Serial port, and set the baud rate to 115200.
- Click OK and view the log output in the terminal window.
Minicom
Minicom is a command line utility for serial port communication on Unix platforms.
Note
You need minicom installed to use this tool.
-
Run the following from a terminal:
$ minicom -D /dev/tty.usbxxx -b 115200where
/dev/tty.usbxxxmatches your serial device.
Example
When using the example "Hello World" program, the output looks like this:
Welcome to minicom 2.9

OPTIONS:
Compiled on Sep 22 2023, 21:10:41.
Port /dev/tty.usbmodem21302, 10:07:03

Press Meta-Z for help on special keys

Hello World!
count = 0
count = 1
count = 2
count = 3
count = 4
count = 5
PuTTY
PuTTY is an open source SSH and telnet client for Windows.
Note
You need PuTTY installed to use this tool.
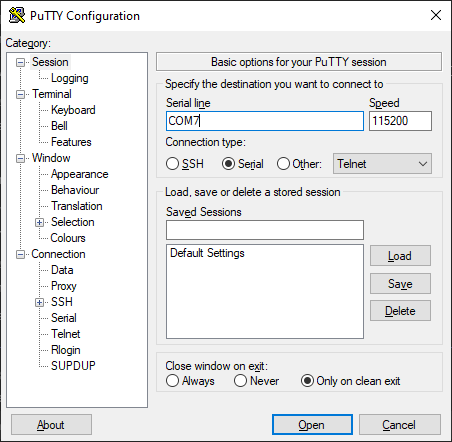
- In the Session category, select Serial as the Connection type.
- Set the Serial line to the correct COM port for your device. Use the Windows Device Manager to find your device under Ports (COM & LPT).
- Set the Speed (baud rate) to 115200.
-
Click Open to start the serial terminal.
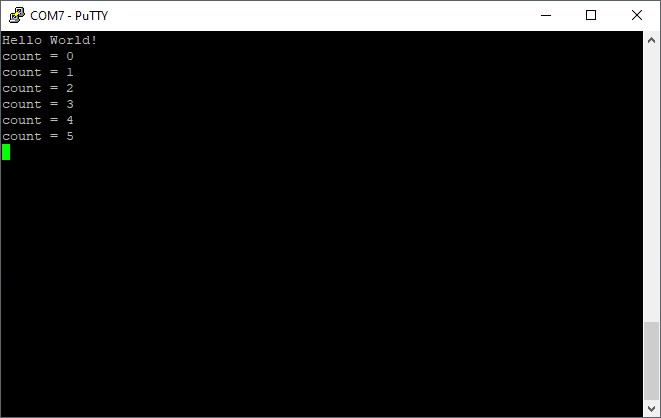
Example
When using the example "Hello World" program, the output looks like this:
Linux configuration
On Linux, add the user to the dialout group in order to use your serial ports.
sudo usermod -aG dialout <username>
RTOS status
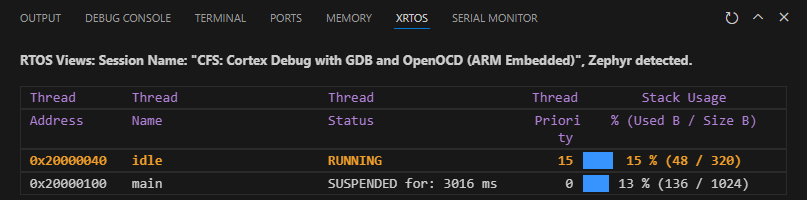
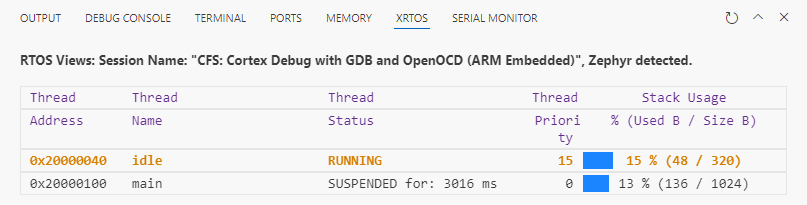
When running an RTOS like Zephyr, you can view essential thread information for the RTOS at a breakpoint using the XRTOS tab.
RTOS requirements
Some RTOSes may require changes in order to provide the debug information required by the XRTOS View.
For Zephyr, the following config flags must be enabled in your prj.conf file:
# Enable thread awareness when debugging
CONFIG_THREAD_NAME=y
CONFIG_DEBUG_THREAD_INFO=y
CONFIG_THREAD_ANALYZER=y
Other RTOSes have their own required config flags. Consult the relevant documentation for configuration information.
Note
You need the RTOS Views extension for VS Code to use this tool.