ELF File Explorer
The ELF File Explorer enables you to quickly parse and analyze compiled binaries, reducing time spent debugging and profiling while providing deeper insight into the application structure.
Supported formats
The CodeFusion Studio ELF File Explorer can open and display the contents of any file with a valid ELF header. The following file extensions are supported: AXF, DOJ, DXE, ELF, EXE, KO, MOD, O, OUT, PRX, PUFF, and SO.
Open an ELF file
You can open an ELF file from the VS Code Activity Bar or the Explorer.
Open from Activity bar
- Click the CodeFusion Studio icon

 in the VS Code Activity Bar.
-
Under ELF File Explorer, click Open ELF File.

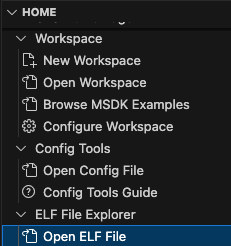
-
Navigate to the ELF file in your project’s build folder (for example,
m4/build/m4.elf).
Open from Explorer
Click any ELF file in the VS Code Explorer to view its contents.
Navigation
Navigation icons are displayed on the left side of the page for Statistics, Metadata, Symbols, and Memory Layout.
Help is available from the help icon in the top right corner.
Statistics
The Statistics page provides high level information about the ELF file and it's contents. Information is displayed across five sections.


File overview
The File overview section summarizes key metadata for the ELF file:
- Format: ELF 32-bit or 64-bit.
- Data Encoding: Endianness (little or big endian).
- File Type: Executable, relocatable, shared object, or core file.
- Architecture: Target architecture (for example, Arm or x86).
- ABI Version: Application Binary Interface version.
- Debug Info: Indicates if the file contains debugging information.
- Stripping: Indicates if the file has been stripped of symbol information.
Main section sizes
The Main section sizes shows the total memory used in the ELF, with a breakdown of the main data types.
- Text: Executable code.
- Data: Initialized global and static variables.
- Bss: Zero-initialized data, both explicitly zero and uninitialized data.
Symbol types
The Symbol types section shows the count of functions and variables by binding type: global, local, and weak. Filters above the table allow you to view all, text, data, or bss symbols.
Sections
The Sections table provides details on all the sections contained within the ELF.
Largest symbols
The Largest symbols table lists the ten largest symbols in the ELF file.
Filters above the table allow you to view all, text, data, or bss symbols.
Metadata
The Metadata page displays a summary of the sizes of each data type (text, data, and bss) and the full contents of the ELF header.
This includes information about the architecture, data layout, ELF version, contents, and flags.
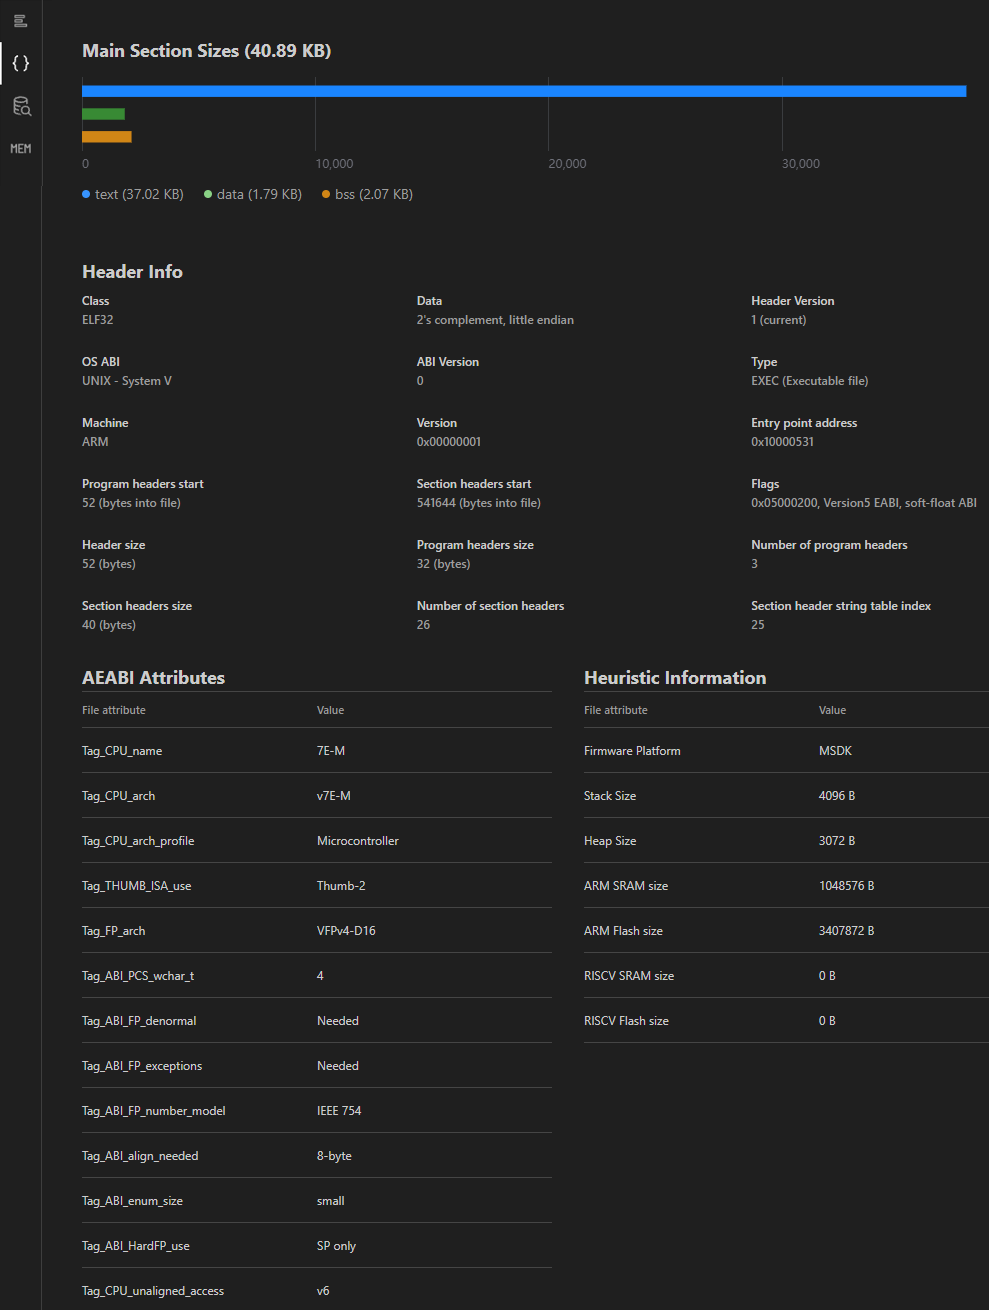
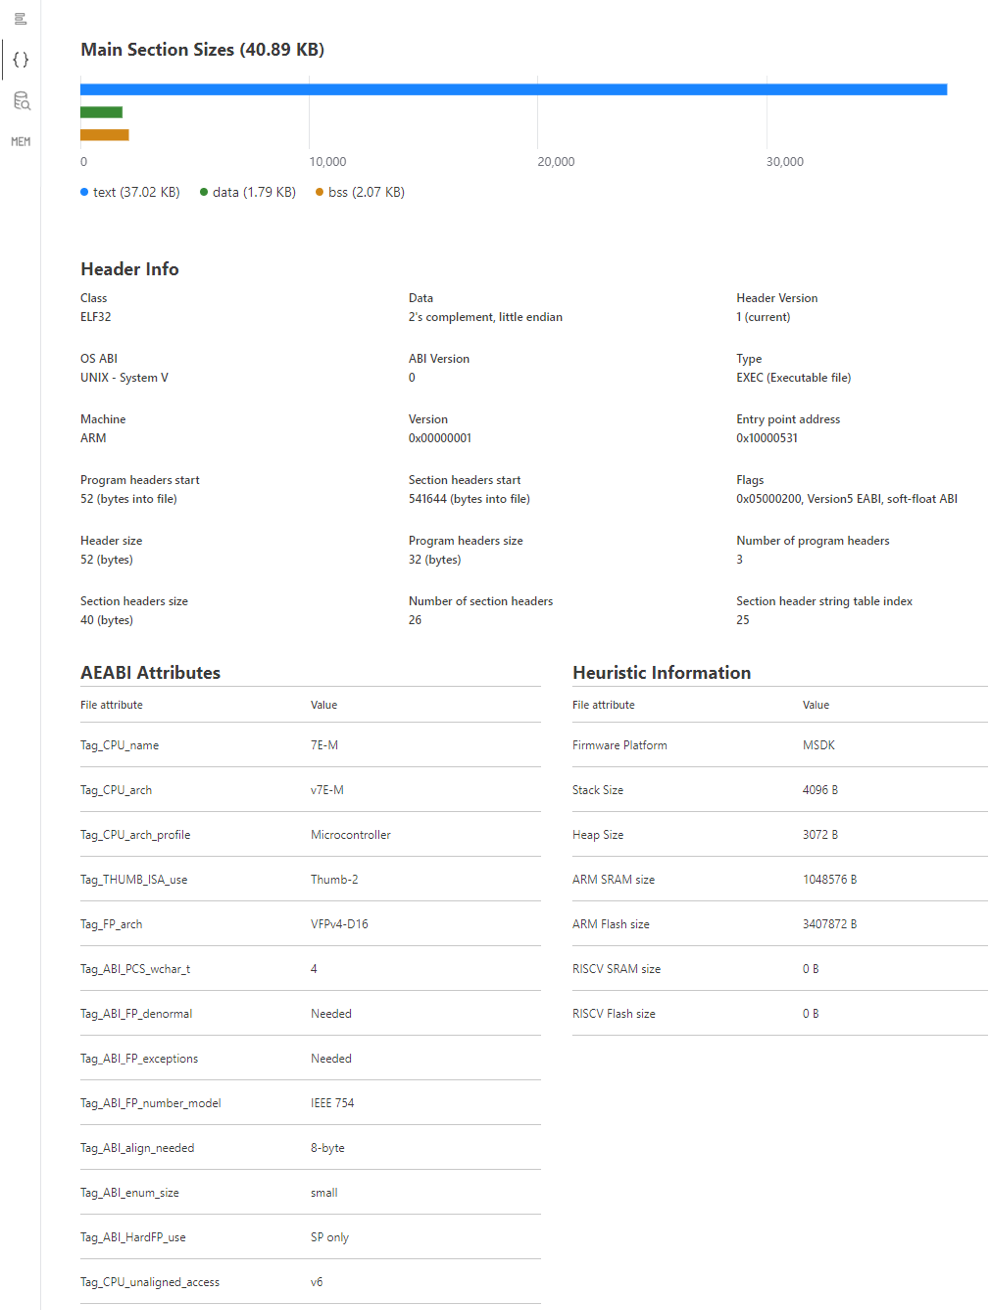
Header Info
The ELF header contains metadata about the ELF file, including its type, architecture, entry point, and program and section headers. This information is required by the operating system to correctly load and execute the file.
AEABI Attributes
The AEABI (Arm Embedded Application Binary Interface) attributes in an ELF file provide important metadata about the binary, such as the target architecture, floating-point configuration, and optimization level. These attributes ensure compatibility and optimize performance by conveying specific details about how the binary was built, allowing tools and runtime environments to correctly interpret and execute the code.
Heuristic Information
Indicates the presence of heuristic information detected in the ELF file for Zephyr and MSDK firmware platforms.
This information may include Flash and RAM sizes and other available metadata.
Symbols Explorer
The Symbol explorer provides a table of all symbols contained in the ELF file. This table can be sorted by clicking the title of any column and filtered using SQL queries for flexible data access.
Note
The Symbol Explorer query engine is based on AlaSQL. As a result, supported syntax and functions are limited to what AlaSQL provides. See the AlaSQL documentation for the full set of supported features and limitations.
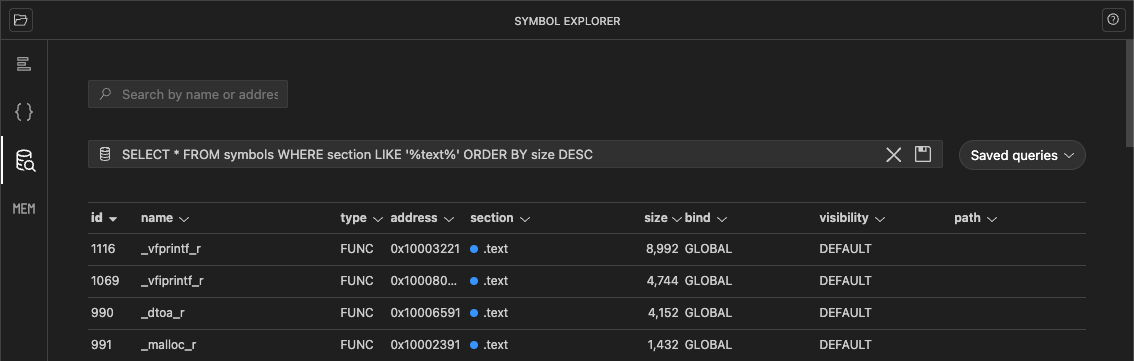
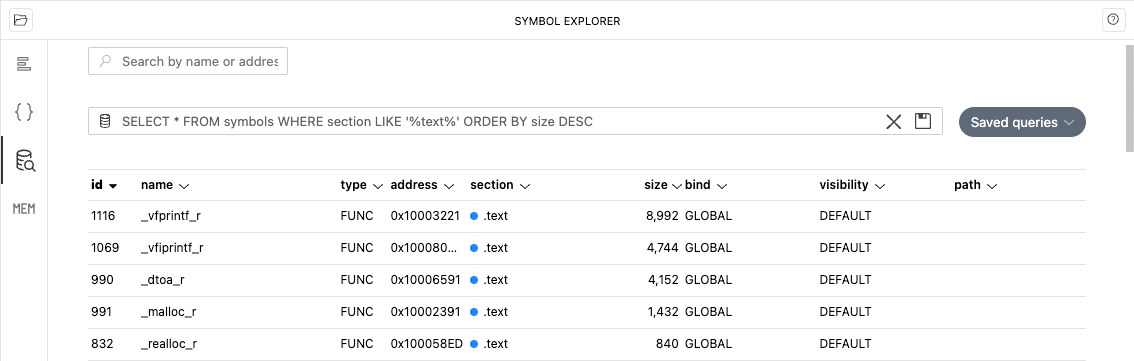
The default query (SELECT *) includes the following fields. You can control which fields are displayed and their order by replacing * with a comma-separated list of field names. For example, SELECT size, name displays the size column followed by name.
| Column | Type | Description |
|---|---|---|
| id | integer | The unique identifier for the symbol |
| name | string | The name of the symbol |
| type | string | The type of the symbol, indicating what kind of entity it represents |
| address | integer | The memory address where the symbol is located |
| section | string | The section of the program in which the symbol is defined |
| size | integer | The size of the symbol in bytes |
| localstack | integer | The worst stack usage size for a function (only local stack, not considering functions called) |
| stack | integer | The worst stack usage size for a function (considering functions called) |
| bind | string | The linkage type of the symbol (for example, local, global) |
| visibility | string | The visibility of the symbol, indicating its accessibility from other modules (for example, default, hidden) |
| path | string | The source file location where the symbol is defined |
Note
The localstack, stack and path columns are only present when the relevant data is present in the ELF.
For localstack and stack, the following GCC switches are required during build:
-fdump-rtl-expand -fstack-usage -fdump-rtl-dfinish -fdump-ipa-cgraph -gdwarf-4.
These switches are enabled by default in CodeFusion Studio projects.
Generating additional compiler data
To generate stack usage (SU) and call graph (CGRAPH) with GCC (required for worst-case stack usage calculations, and call graph navigation), compile your code with the following flags: -fstack-usage -fdump-ipa-cgraph -gdwarf-4.
These flags will force the compiler to generate debug information using the DWARF-4 standard, which is the version currently supported by the built-in DWARF parser.
Zephyr
For Zephyr projects, add the following flags to CMakeLists.txt:
  zephyr_cc_option(-fstack-usage)
  zephyr_cc_option(-fdump-ipa-cgraph)
  zephyr_cc_option(-gdwarf-4)
MSDK
For MSDK projects, add the following flags to the Makefile:
  PROJ_CFLAGS += -fstack-usage
  PROJ_CFLAGS += -fdump-ipa-cgraph
  PROJ_CFLAGS += -gdwarf-4
Note
Stack usage and call graph data can only be parsed when generated by GCC.
Filters
The table can be filtered using SQL queries, where the table name is symbols and the fields are as above.
Tip
A quick lookup field above the table allows filtering by name or address. Enter a text or numerical value and press Enter to generate a query.
Queries
Queries can be saved using the save icon to the right of the query field.
Click the Saved queries button to the right of the query field to view a list of saved queries, including pre-populated queries. Queries can be edited or deleted from the list by clicking the pencil or trash can icons.
Note
Saved queries are stored in user settings and are available across workspaces.
Any valid SQL construct is supported, including WHERE, ORDER, LIMIT, LIKE and REGEXP.
Some examples of queries are as follows.
| Filter | Query |
|---|---|
| Specific colums | SELECT name,address FROM symbols |
| Symbols larger than 100 bytes | SELECT * FROM symbols WHERE size > 100 |
| Largest symbols | SELECT * FROM symbols ORDER BY size DESC LIMIT 10 |
| Symbols between addresses | SELECT * FROM symbols WHERE address BETWEEN 0x10000000 AND 0x20000000 |
| Symbols from a specific file | SELECT * FROM symbols WHERE path LIKE '%main.c%' |
| Symbols starting with string | SELECT * FROM symbols WHERE name REGEXP '^init.*' |
Memory Layout
The Memory Layout page provides a visual representation of the memory map on the left and a table of memory segments on the right. Memory usage is displayed as follows:
- Stripes: Unused memory.
- Blank: Read/write memory.
- Filled: Read only memory.
Note
Overlapping segments are rendered as smaller rectangles to the right of the main segment. Small segments may appear larger than their actual size for readability. Refer to the size values for accuracy.
Hovering over a segment in the memory map displays a summary of the memory segment and highlights the corresponding entry in the table. Hovering over a segment in the table highlights the corresponding segment in the memory map.
Segments
The Segments table provides a high-level summary of each memory segment.


The table includes the following fields:
| Field | Description |
|---|---|
| Id | The unique identifier for the segment |
| Type | The type of the segment, indicating its purpose (e.g., loadable, dynamic) |
| Address | The start address of the segment |
| Size | The size of the segment in bytes |
| Flags | Permissions and attributes for the segment (R: read, W: write, X: executable) |
| Align | The alignment requirement of the segment in memory in bytes |
Clicking a segment displays the sections contained within it.
Sections in a Segment
This table summarizes all sections in the selected memory segment.
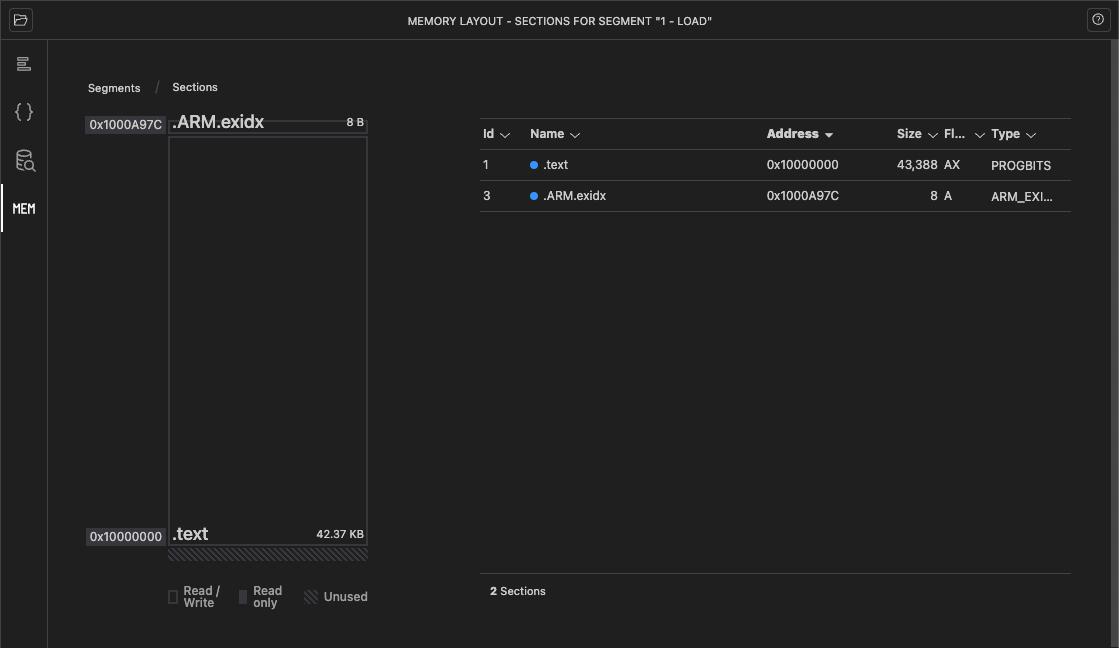
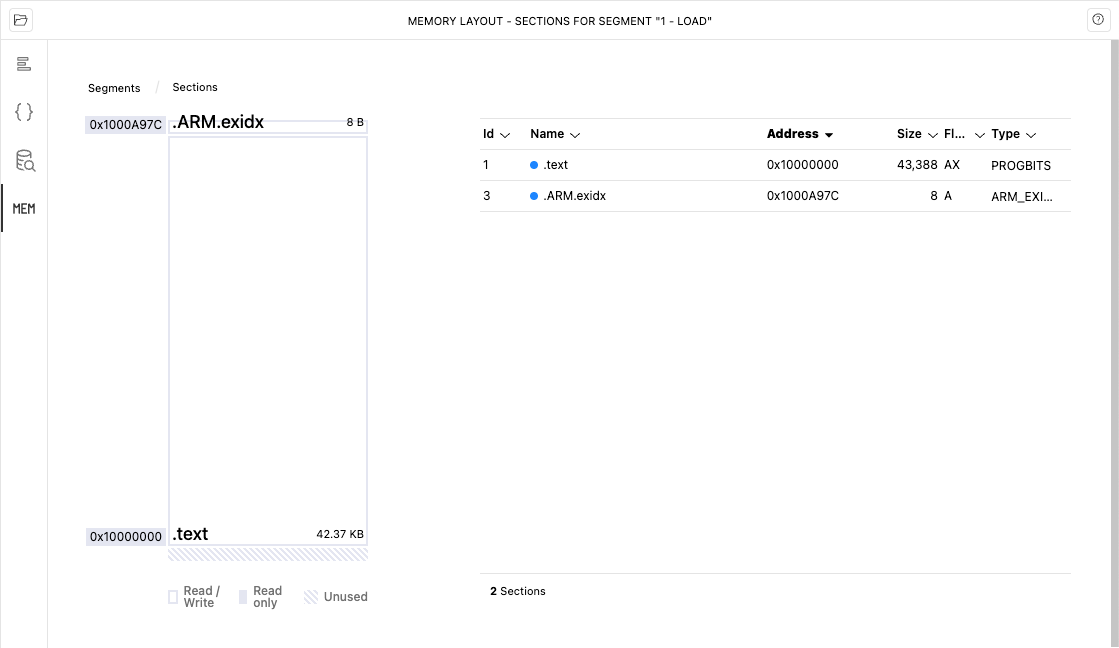
The Sections in a Segment table includes the following fields:
| Field | Description |
|---|---|
| Id | The unique identifier for the section |
| Name | The name of the section |
| Address | The start address of the section |
| Size | The size of the section in bytes |
| Flags | Permissions and attributes for the section described in the flags table |
| Type | The type of the section, indicating its contents and purpose |
| Flag | Description |
|---|---|
| W | write |
| A | alloc |
| X | execute |
| M | merge |
| S | strings |
| I | info |
| L | link order |
| O | extra OS processing required |
| G | group |
| T | TLS |
| C | compressed |
| x | unknown |
| o | OS specific |
| E | exclude |
| D | mbind |
| y | purecode |
| p | processor specific |
Click a section to view the symbols it contains. To return to Segments, click the Segments link in the breadcrumb at the top left of the page.
Symbols in a Section
This table lists symbols within the selected section.
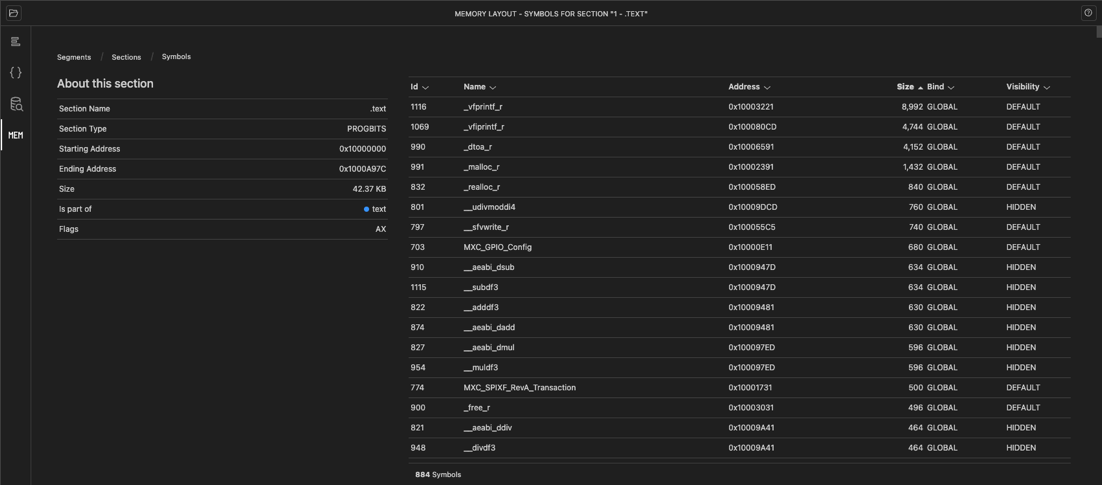
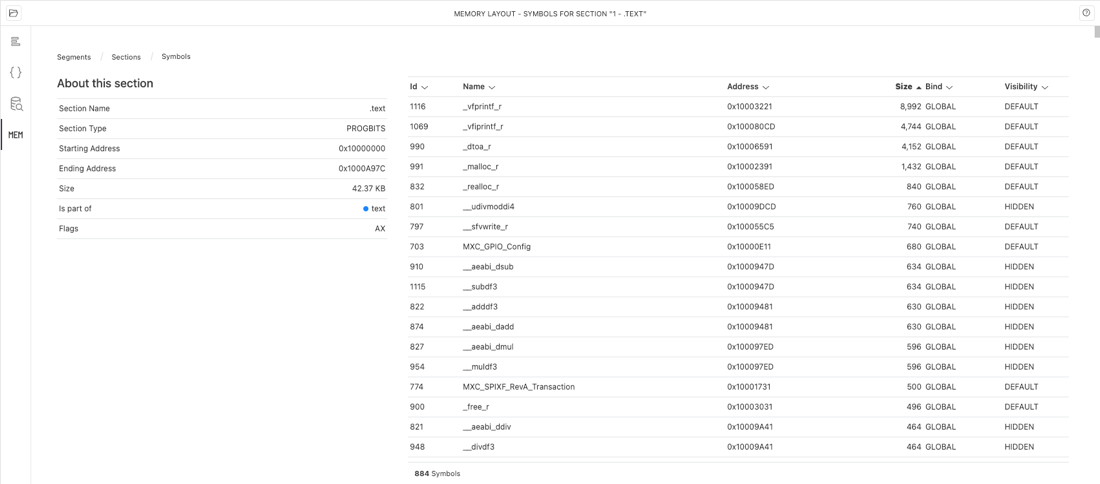
The Symbols in a section table includes the following fields:
| Field | Description |
|---|---|
| Id | The unique identifier for the symbol |
| Name | The name of the symbol |
| Address | The memory address where the symbol is located |
| Size | The size of the symbol in bytes |
| Bind | The linkage type of the symbol (for example: local, global) |
| Visibility | The visibility of the symbol, indicating its accessibility from other modules (for example: default, hidden) |
To return to the Sections Segments, click on the appropriate link in the breadcrumb at the top left of the page.