Standard Analyzers
Evaluation Studio provides three standard analyzers: Waveform, CommonFFT, and Histogram. Each plots the captured data a different way and reports its own set of results. Pick which one a chart shows using the dropdown on the left of the chart's toolbar.
Which of them a device offers is up to the device, and it may add analyzers of its own. Those appear in the same dropdown, with their own result columns.
For how to run a capture and use the charts, see Analysis.
Waveform
Samples plotted in the time domain.
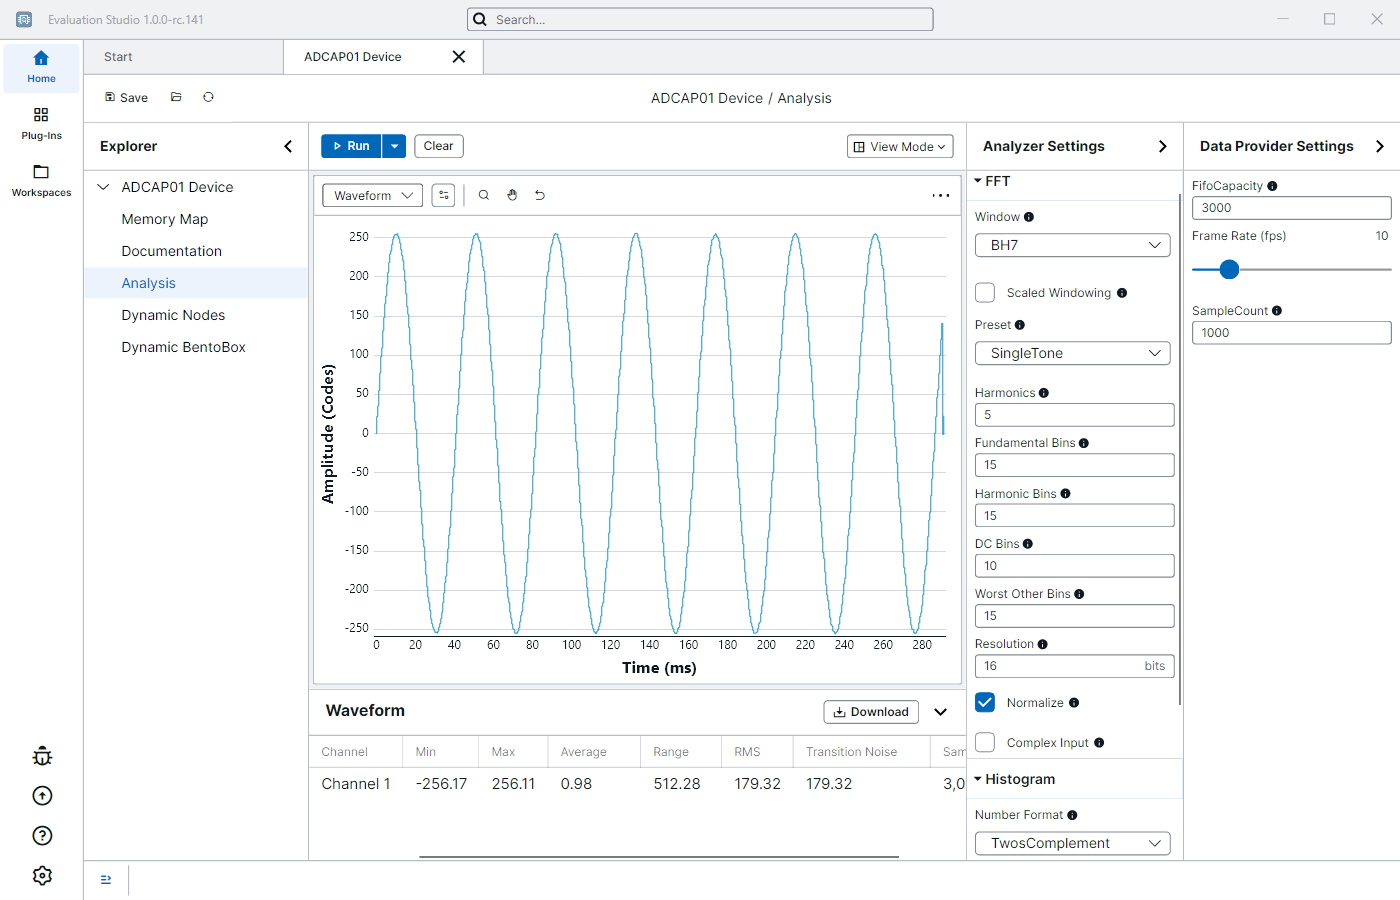
| Result | Meaning |
|---|---|
| Min, Max | Lowest and highest sample. |
| Range | Max minus Min. |
| Average | Mean of all samples. |
| RMS | Root mean square. |
| Transition Noise | Spread of the samples, in codes. |
| Samples | How many samples were analysed. |
CommonFFT
The signal split into its component frequencies, used to measure noise and distortion.
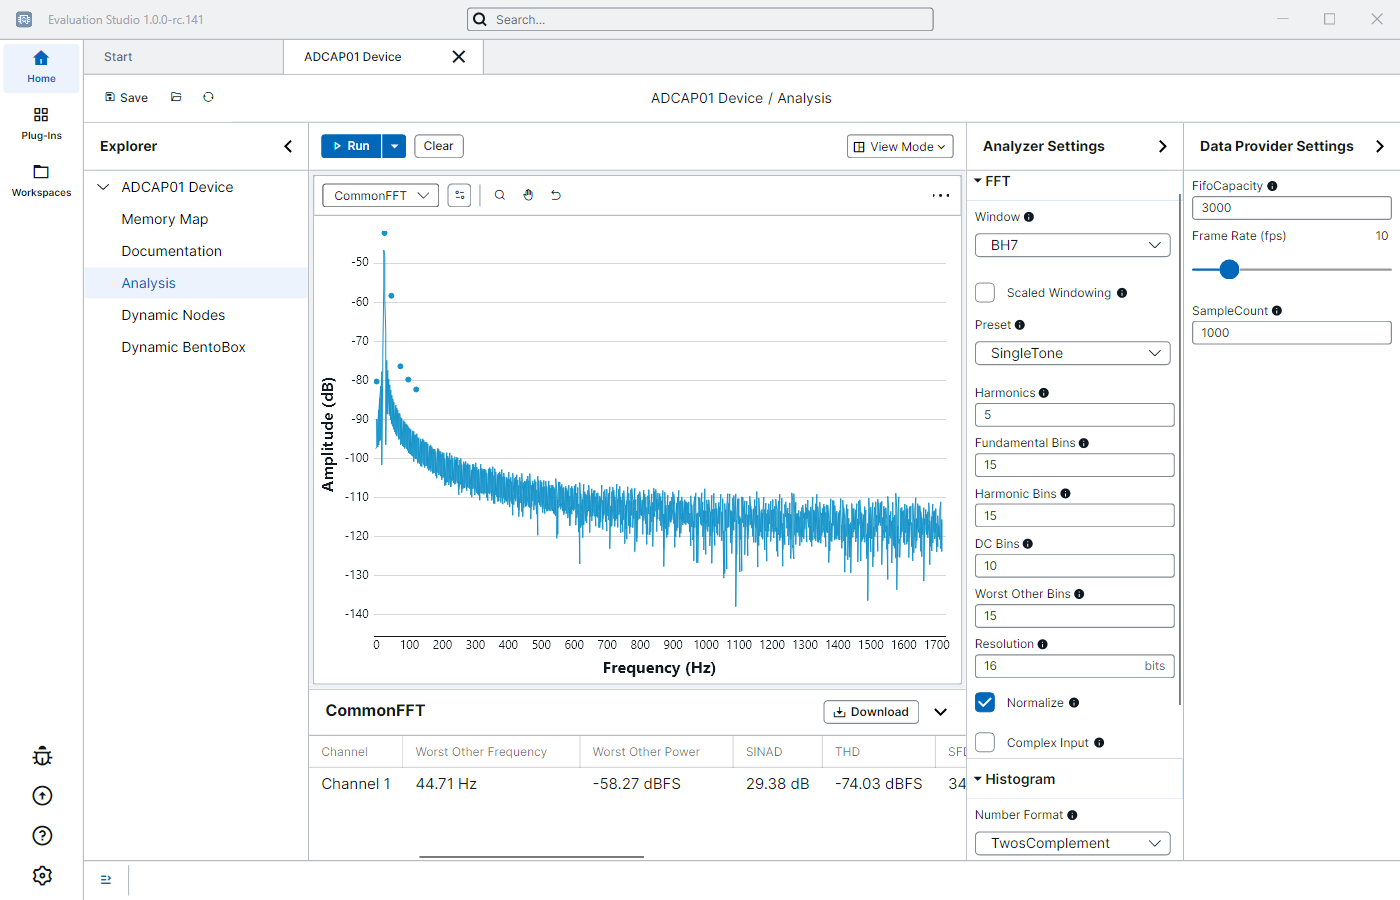
The labelled dots are placed for you. They mark the fundamental, its harmonics, DC, and the largest unwanted spike.
| Result | Meaning |
|---|---|
| SINAD | Signal compared with all noise and distortion together. |
| SNR | Signal compared with the noise, ignoring the harmonics. |
| SNR FS | The same, measured against full scale rather than the signal level. |
| THD | Total harmonic distortion — how much power lands on the harmonics. |
| SFDR | Gap between the signal and the largest unwanted spike. |
| Worst Other Frequency, Worst Other Power | Where that spike is, and how big. |
| Avg Bin Noise, Noise Per Hz | Noise floor, averaged per bin and per hertz. |
| Samples, Sample Frequency | How many samples, and how fast they were taken. |
You also get a frequency and a power column for each spike found.
Histogram
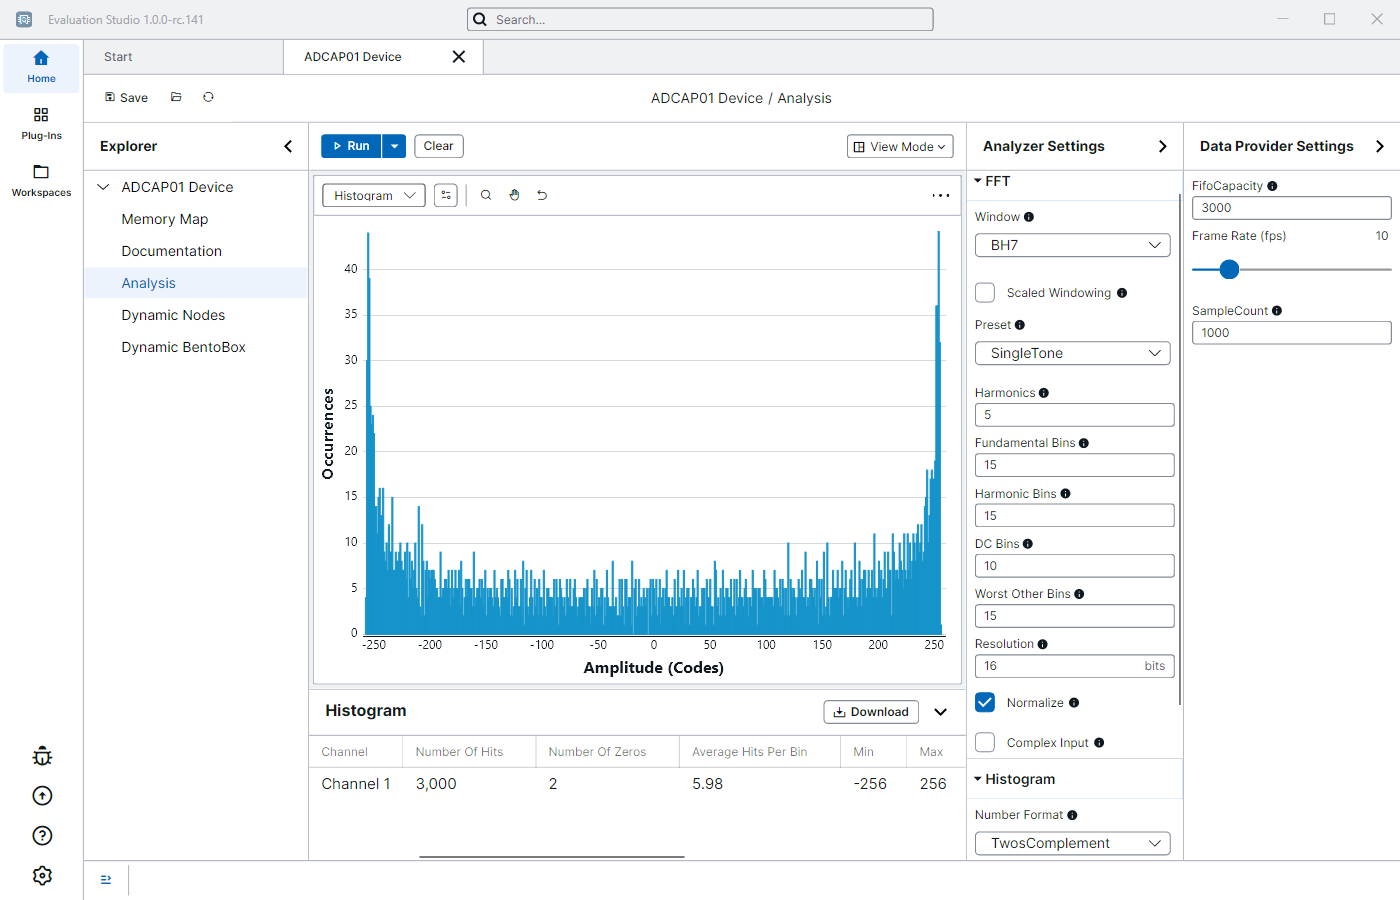
How often each code appears.
| Result | Meaning |
|---|---|
| Number Of Hits | Total samples counted. |
| Number Of Zeros | Bins that received no samples. |
| Average Hits Per Bin | Hits divided by the number of bins used. |
| Min, Max, Range | Lowest code, highest code, and the gap between them. |
| Average, RMS | Mean and root mean square of the codes. |
| Transition Noise | Spread of the codes, in codes. |
| Sample Frequency | How fast the samples were taken. |
Related
- Analysis — run a capture and use the charts and results table.
- Memory Map — change a register, then run another capture to see the signal change.