Read the application log
By the end of this page you will have opened the logging view, read a log message and its exception, narrowed the list by severity, and found the log file on disk.
What the logging view shows
The logging view is the collapsible panel across the bottom of the main window. It is a live view of the messages Evaluation Studio and its plug-ins emit as you work — opening hardware, reading registers, loading plug-ins, running scripts. It is the first place to look when an operation reports success but nothing happens, or when a toast tells you something failed without saying why.
The panel has two tabs:
- Log — the message grid, and the subject of this page.
- Recorder — the transaction recorder, which records what you do in the app so you can replay it. See Recording.
Two things are worth knowing before you start:
- The panel starts collapsed on every launch. Whether you left it expanded is not saved between sessions.
- The log file on disk holds more than the panel. Every message is written to the file.
The panel receives them all too, but it hides
TraceandDebugmessages until you turn on a developer setting, and it keeps only the most recent 100,000 messages.
Before you start
- Evaluation Studio running. Nothing else is needed — the log fills up from startup onwards.
- The severity filters and counts described below are hidden unless Show Debug Events in Log Window is on. Turn it on from the Developer tab of Application Settings, then close the settings window — settings there are saved on close, so the change does not reach the logging view until you do. See Settings. It is off by default, so if you have never changed it the bottom strip shows only the collapse toggle.
Steps
-
Expand the panel. Click the collapse toggle (1) at the far left of the bottom strip. The panel grows upwards, showing the tab strip (7) and the log grid (8).
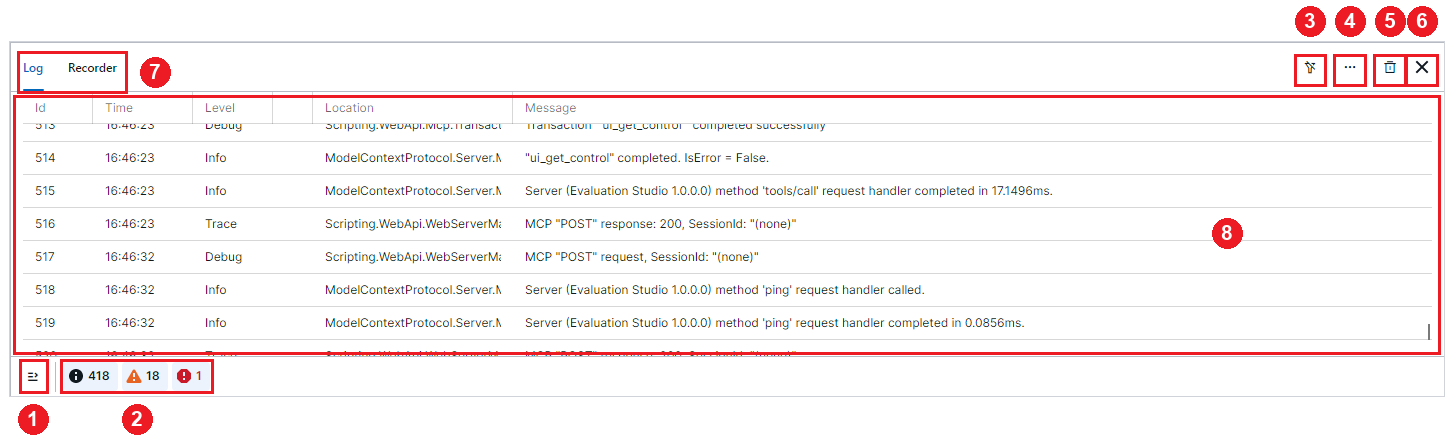 The Log tab with Show Debug Events in Log Window enabled, so the severity filters
(2) are visible and
TraceandDebugrows reach the grid. The controls are numbered in the reference table below. -
Read a row. Each row is one message: when it happened, how severe it was, which part of the app emitted it, and the text. See The log grid for the columns.
The grid follows the newest message — as rows arrive it scrolls to the bottom, so the latest one stays in view.
-
Read the exception behind a failure. A message carrying an exception shows a warning icon in the narrow unnamed column. Hover the icon to see the full exception — type, message and stack trace — in a tooltip. Rows without an exception leave the column blank.
-
Narrow the list by severity. Uncheck the info, warning or error toggle (2) to hide that severity. The toggles carry no captions — each is a coloured severity icon beside a count, in the order info, warning, error — so identify them by icon rather than by name. They only appear when Show Debug Events in Log Window is on, and are only clickable while the Log tab is the selected tab.
-
Reset the filters. Click Clear Filters (3) — its tooltip reads Clear Log Filters — to re-check all three severities. Every message comes back.
-
Find the log file. Click More (4), then Open Log Folder. File Explorer opens on the folder holding the current log file. This is how you read messages from earlier sessions, or messages the panel has already dropped.
The folder is
%LOCALAPPDATA%\Analog Devices\Evaluation Studio\Logs, unless the app was launched with--data-dir. The current session writes toEvaluation Studio.log; earlier sessions are archived asEvaluation Studio {timestamp}.log. The file rotates when the app starts and whenever it passes 20 MB, keeping 10 days or 50 archives, whichever comes first. -
Empty the grid. Click Clear Log (5) to discard the messages the panel is holding and zero the three counts, giving you a clean slate before you reproduce a problem.
Clear Log does not touch the file
Clear Log clears the view only. Everything you cleared is still in
Evaluation Studio.log, so clearing before a reproduction is safe and the file remains the complete record. MessageIds restart from 1 after a clear. -
Collapse the panel again. Click the ✕ (6) at the top right, or the collapse toggle (1). Both collapse the panel back to the strip; neither closes or resets it, and the messages are still there when you expand it again.
Toolbar reference
| # | Control | What it does |
|---|---|---|
| 1 | Collapse toggle | Expands and collapses the panel. Always on the bottom strip, whichever tab is selected. |
| 2 | Severity toggles | Three filters — info, warning, error, in that order — each a severity icon beside a running count, with no text caption. Hidden unless Show Debug Events in Log Window is on; greyed out unless the panel is expanded and the Log tab is selected. See Severity filters and counts. |
| 3 | Clear Filters | Re-checks all three severity filters. Tooltip: Clear Log Filters. |
| 4 | More | Opens a menu holding one item, Open Log Folder, which opens the folder containing the current log file. |
| 5 | Clear Log | Discards the messages held in the view and zeroes the three counts. Leaves the log file untouched. |
| 6 | ✕ | Collapses the panel. Tooltip: Collapse log panel. Present on both tabs. |
| 7 | Tab strip | Switches between Log and Recorder. |
| 8 | Log grid | The messages. See The log grid. |
Controls (3), (4) and (5) belong to the Log tab, and are replaced by the recorder's own controls when you switch to Recorder.
The log grid
| Column | What it shows |
|---|---|
Id |
A sequence number counting from 1 for the session. Useful as a marker: note the highest Id before you reproduce a problem, and everything after it is new. |
Time |
When the message was emitted, as HH:mm:ss. No date — for dated timestamps, read the log file. |
Level |
The message's true severity: Trace, Debug, Info, Warn, Error or Fatal. |
| (unnamed) | A warning icon when the message carries an exception. Hover it for the full exception text. Blank otherwise. |
Location |
The logger that emitted the message. Evaluation Studio's own loggers have the AnalogDevices.Desktop.Kitana. prefix stripped, so they read as e.g. Hardware.Device. Loggers from elsewhere — plug-ins, and libraries such as ModelContextProtocol.Server.* — keep their full namespace, so this column is a mix of short and long names. |
Message |
The message text, wrapped over as many lines as it needs. |
Two things about this grid differ from most grids in the app:
- You cannot sort it. Rows are always in
Idorder, oldest first, so the log reads as a chronology. You can reorder and resize the columns. Levelis finer-grained than the filters. The column shows the true level, but the filters work on three buckets:Trace,DebugandInfoall count as info,Warnas warning, andErrorandFatalas error. So aFatalrow is hidden by unchecking the error toggle, and there is no way to filterDebugout on its own.
Severity filters and counts
The three toggles (2) sit together at the left of the bottom strip, in the order info, warning, error. Each is a coloured severity icon beside a number, with no text caption, so read the icon to tell them apart. Each does two jobs: its checked state filters the grid, and the number counts messages.
As filters, they are additive. Uncheck one to hide that bucket, check it again to bring it back. Unchecking all three shows an empty grid — no severity is admitted, so nothing matches. Clear Filters (3) re-checks all three.
As counts, they are running session totals: each number is how many messages of that severity have arrived since the app started, or since the last Clear Log. They only ever go up.
The counts are not filtered counts
Because the number sits inside the toggle, it reads like "how many rows this filter is showing". It is not. Unchecking the info toggle empties the info rows out of the grid but leaves the info count exactly where it was. Only Clear Log resets the counts.
For the same reason, turning Show Debug Events in Log Window on mid-session brings
existing Trace and Debug rows into the grid — as soon as you close the settings window,
with no restart needed — but does not add them to the info count. Counting happens as
each message arrives, and those had already arrived.
The whole cluster is hidden while Show Debug Events in Log Window is off, so on a default
install the bottom strip shows only the collapse toggle. Turning the setting on does two things
at once: it reveals these toggles, and it lets Trace and Debug messages into the grid.
Verify
- Click the collapse toggle. The panel expands and the grid holds messages — at minimum, this session's startup messages.
- Note the highest
Idin the grid, then do something in the app, such as opening a device. New rows appear beneath it and the grid scrolls to the newest. - With Show Debug Events in Log Window on, uncheck the info toggle — the leftmost of the three. The info rows disappear from the grid, and the number beside its icon does not change — that is the count behaving as designed.
- Click Clear Filters. All three toggles are checked again and the hidden rows return.
- Click Clear Log. The grid empties and all three counts read
0. The next message to arrive hasId1. - Click More ▸ Open Log Folder. File Explorer opens on the log folder. Open
Evaluation Studio.logand read the end of it: the messages you cleared in step 5 are still there, which confirms Clear Log cleared the view only.
If the panel expands but the grid stays empty while the app is plainly doing things, start with the first three rows of the Troubleshooting table.
Troubleshooting
| Symptom | Cause | Fix |
|---|---|---|
| No severity toggles on the bottom strip | The cluster is hidden, not disabled, while Show Debug Events in Log Window is off — the default. | Turn the setting on from the Developer tab of Application Settings, then close that window — the change commits on close. See Settings. |
| You turned the setting on but the toggles still are not there | The Application Settings window is still open. It has no Save button; changes commit when the window closes. | Close the settings window. |
| The toggles are visible but greyed out | They are enabled only while the panel is expanded and the Log tab is selected. | Expand the panel and select Log. |
| The grid is empty although messages are clearly being logged | All three severity toggles are unchecked, so the filter admits nothing. | Click Clear Filters. |
| A count does not go down when you uncheck its filter | The counts are running session totals, incremented as messages arrive. They are not filtered counts. | Working as designed. Click Clear Log to reset all three. |
You turned on Show Debug Events in Log Window mid-session; Trace and Debug rows appeared but the info count did not rise |
Filtering re-evaluates the messages already held; counting happens once, on arrival. | Working as designed. Clear Log and reproduce if you need the counts to match what is on screen. |
Clear Log emptied the grid but a count is already above 0 |
Messages kept arriving in the moment after the clear, and each one is counted. | Working as designed — the count matches what has arrived since the clear, not what is selected. |
A Fatal row vanishes when you uncheck the error toggle |
The Level column shows the true level; the filters work on three buckets, and Fatal falls in the error bucket. |
Re-check the error toggle to bring it back. |
Trace or Debug rows you cannot filter out on their own |
There is no separate toggle for them — they fall in the info bucket. | Turn Show Debug Events in Log Window off to hide them entirely. |
| Older messages have gone, and you did not click Clear Log | The panel keeps the most recent 100,000 messages and drops the oldest beyond that. | Read the older messages in Evaluation Studio.log via More ▸ Open Log Folder. |
| Messages you cleared are still in the log file | Clear Log clears the view only. | Working as designed — it is what makes the file a complete record. |
Open Log Folder does nothing, or a toast reads Couldn't open the log directory. |
The folder no longer exists, or the shell could not open it. | Browse to %LOCALAPPDATA%\Analog Devices\Evaluation Studio\Logs yourself, or to the path you passed to --data-dir. |
A toast at startup reads Couldn't find the log file path. |
No log file target resolved, so the app does not know which folder to open. Open Log Folder will not work for this session. | Restart the app. If it recurs, report it — the report attaches the log for you. |
| The panel is collapsed again after a restart | The expanded state is per-session and is not saved. | Expand it with the collapse toggle. |
Related
- Settings — turning on Show Debug Events in Log Window.
- Recording — the Recorder tab, and replaying what you did.
- Report an Issue — sending the log to us with a problem report.