Settings
Application-wide preferences live in the Application Settings window — click the gear button at the bottom of the left rail to open it. Settings are grouped into tabs: Environment, Plug-ins, Scripting, and Developer, and an installed plug-in can add tabs of its own.
Note
There is no Save button — your changes are saved when you close the window, and most take effect immediately at that point. Two exceptions: the theme applies (and is saved) the moment you toggle it, and a tab containing an invalid value is skipped when the window closes — a notification names the tab so you can reopen and fix it.
Environment
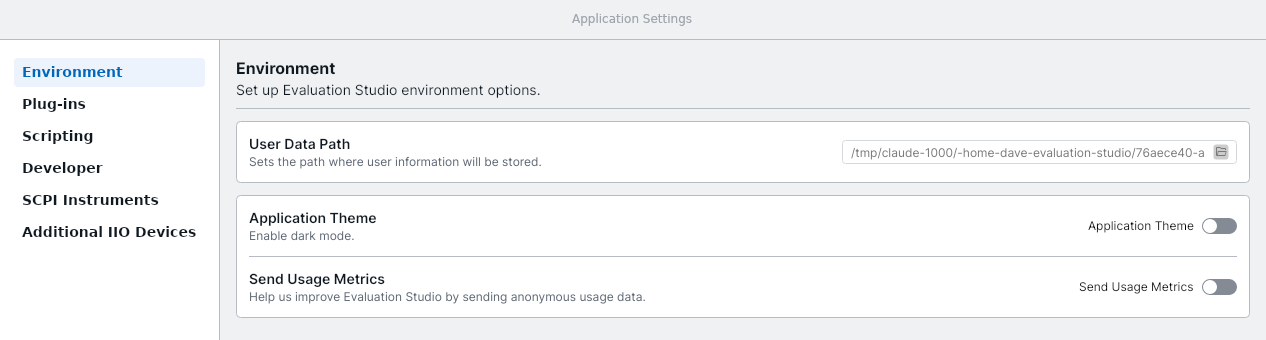
| Setting | What it does |
|---|---|
| User Data Path | Shows where your profile lives — settings, logs, workspaces, and application state. Read-only: to relocate it, start Evaluation Studio with --data-dir <path> (see below). |
| Application Theme | Switches between light and dark mode. Applies immediately. |
| Send Usage Metrics | Opts in or out of anonymous usage data (see Privacy). |
Plug-ins
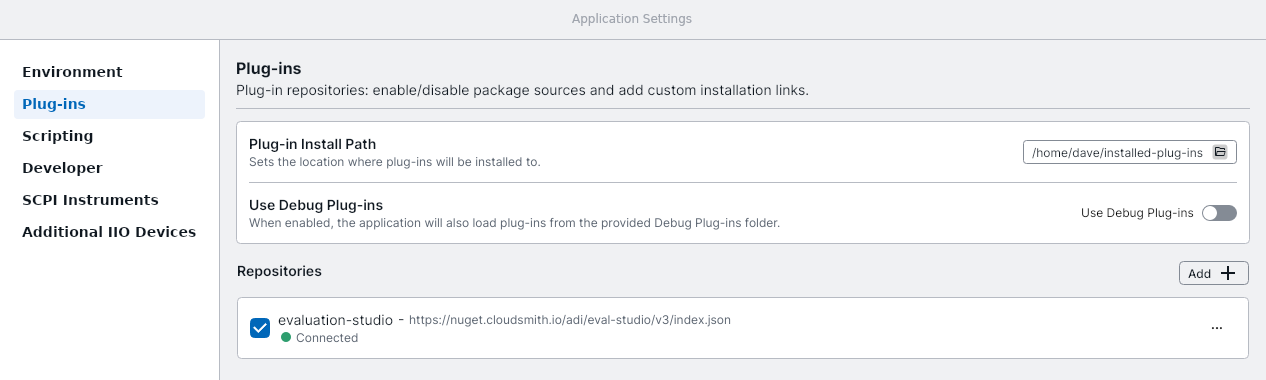
| Setting | What it does |
|---|---|
| Plug-in Install Path | The folder plug-in packages install into. Must be an existing directory. Read-only when a --plugins-dir launch override is active. |
| Use Debug Plug-ins | Also loads unpackaged plug-ins from the debug plug-ins folder — for people developing plug-ins; leave off otherwise. |
| Repositories | The package feeds plug-ins are found in, in priority order. Each repository has an enable checkbox and a live connection indicator. |
To add a repository:
- Click Add in the Repositories header.
- Enter a name and the feed URL. For a private feed, turn on Requires Authentication and enter the username and password — credentials are stored encrypted.
- Use the priority arrows on a repository row to control which feed wins when the same plug-in exists in several.
Scripting
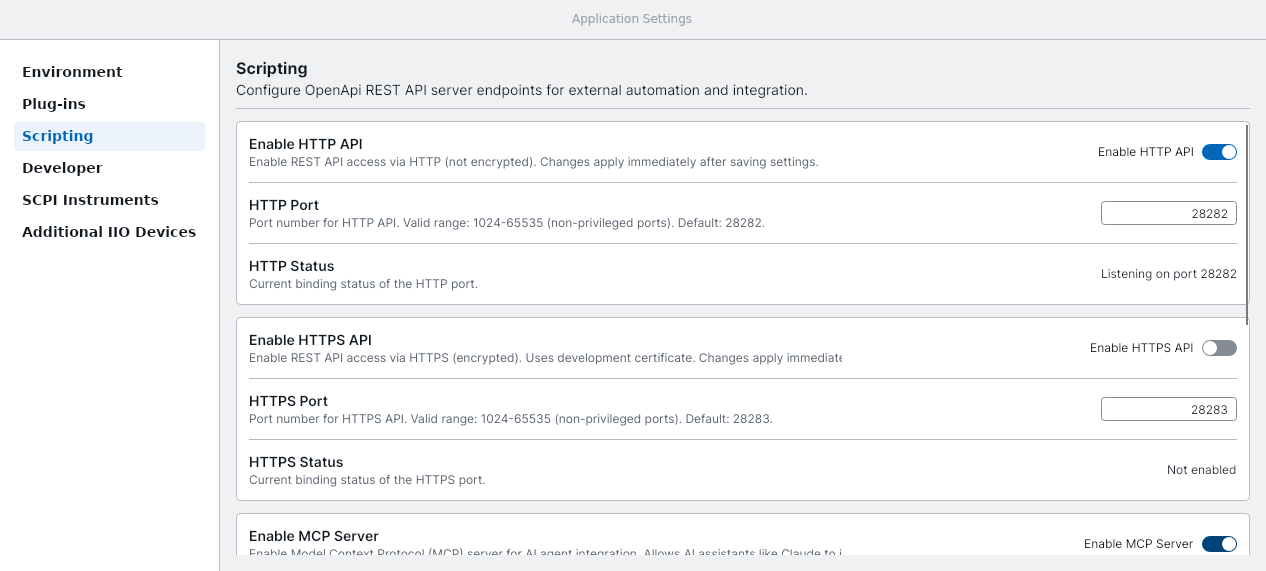
| Setting | What it does |
|---|---|
| Enable HTTP API / HTTP Port | Turns on the REST automation API over plain HTTP (default port 28282; valid range 1024–65535). Applies when the window closes. |
| Enable HTTPS API / HTTPS Port | The same API over HTTPS (default 28283), using a development certificate. |
| HTTP / HTTPS Status | Live status of each endpoint — Listening on port N, Not enabled, or Port N unavailable. This reports what is actually bound, so it also reflects command-line port overrides. |
| Enable MCP Server | Lets AI assistants operate Evaluation Studio. Requires the HTTP or HTTPS API to be enabled. |
| Enable UI Automation Tools | Lets AI agents take screenshots of the application. |
| Enable Transaction Tools | Exposes operations — driving the UI, captures, register access, plug-in commands — as AI-agent tools. |
| Allow Remote Connections | Accepts API connections from other machines instead of just this one. The API has no authentication — only enable this on a trusted network. |
| Connect an AI client | Pick your AI client (Claude Code, VS Code, Cursor, …) and copy a ready-made configuration snippet for it. Covered in detail in Connect an AI Assistant. |
Developer
Diagnostic options for people working on Evaluation Studio itself. If you are evaluating hardware, you can ignore this tab.
Privacy and usage metrics
The first time you run Evaluation Studio it asks whether to share anonymous diagnostics and usage data:
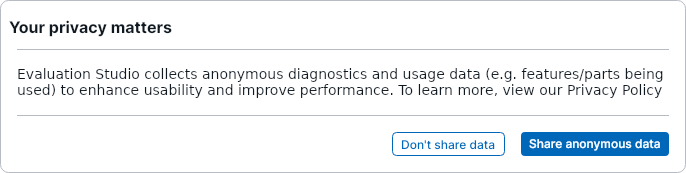
Nothing is sent unless you choose Share anonymous data — the data carries a random identifier, never your name or files. You can change your mind at any time with Send Usage Metrics on the Environment tab.
Where settings are stored
Settings persist in UserSettings/userSettings.json inside your user
data path — by default
%LocalAppData%/Analog Devices/Evaluation Studio on Windows. Repository
passwords and API keys in the file are encrypted.
Launch options that override settings
A few command-line options override what is configured here, for one run only — they are never written back to your settings:
--data-dir <path>— use a different profile (settings, logs, workspaces, recordings). An empty folder behaves like a fresh install.--plugins-dir <path>— load plug-ins from a different folder; the Plug-in Install Path field becomes read-only while active.--http <port>/--https <port>— force the scripting API on at the given port. The Scripting tab's toggles still show your saved preference, but the Status lines show the port actually in use.
If the settings file is damaged
Evaluation Studio deliberately refuses to guess: a damaged
userSettings.json stops startup with an error screen that names
your data folder. Fix the file, or delete it to start over with
defaults — a missing file is recreated automatically.
Troubleshooting
| Symptom | Cause | Fix |
|---|---|---|
| A change didn't stick | The tab contained an invalid value when the window closed, so that tab was skipped (a notification names it) | Reopen Settings, fix the highlighted value, close the window again |
| HTTP Status says Port N unavailable | Another program (or another Evaluation Studio) is using the port | Choose a different port, or close the other program |
| Startup fails with a settings error | The settings file is damaged | Fix or delete UserSettings/userSettings.json in your data folder |