Connect an AI Assistant
Evaluation Studio can be operated by an AI assistant. Connect a client like Claude Code and you can talk to your bench: ask it to open a board, run a capture and tell you what it sees, dig through the logs, or walk a repetitive setup sequence for you — while you watch every step happen in the application.

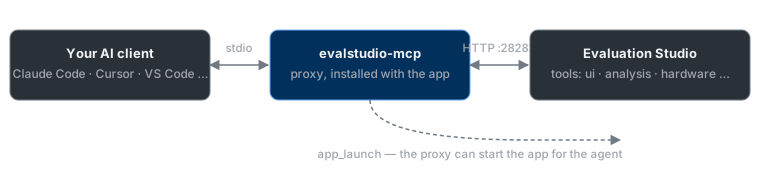
The evalstudio-mcp proxy ships with Evaluation Studio and bridges your
AI client to the application using MCP. It is available even when the app
is closed — the agent can start Evaluation Studio itself.
Set it up
- Open Settings → Scripting and scroll to Connect an AI client.
-
Pick your client — Claude Code, Claude Desktop, VS Code, Cursor, Windsurf, Visual Studio, Codex CLI, Gemini CLI, or JetBrains AI Assistant — and copy the generated snippet.

-
Put the snippet where the panel's Where it goes line says — for Claude Code it is one terminal command; for most other clients it is a short block in their MCP configuration file.
- Start a conversation and ask the assistant to check the connection —
it can call
app_status, and if Evaluation Studio isn't running it can launch it withapp_launch.
Tip
If the agent launches Evaluation Studio itself, you don't need to
change any settings first — app_launch enables the API for that
session automatically. Only when you want the agent to attach to a
copy of the app you started do Enable HTTP API and Enable MCP
Server need to be on in Settings.
What the assistant can do
The connected client sees Evaluation Studio's operations as tools, grouped by prefix:
| Tools | What they let the assistant do |
|---|---|
app_* |
Check, start, and stop Evaluation Studio itself |
ui_*, screenshot |
See and drive the user interface — navigate views, click controls, fill fields, read what's on screen, take screenshots |
hardware_* |
Discover and open connected evaluation boards |
analysis_* |
Capture data, run analyzers, export results |
memmap_* |
Read and write device registers |
plugin_* |
Install, update, and manage plug-ins |
diagnose_* |
Read the application log, check performance, draft issue reports |
Installed plug-ins add their own tools, prefixed with the plug-in's
name — a signal-generator plug-in contributes signals_*, an instrument
plug-in its SCPI console, and so on. The server also publishes task
guides (as MCP resources) that teach the assistant how to drive the UI
and capture data effectively — no prompting needed from you.
What it looks like
A real exchange, with an ADALM2000 attached (the tool calls the assistant made are shown inline):
You: Connect to my bench and grab a capture from the ADALM2000 — is there anything on the inputs?
Assistant: app_status — Evaluation Studio is running.
hardware_open_attached_hardware — I've opened the ADALM2000 that's
connected at ip:192.168.2.1. ui_navigate — now on its Oscilloscope
page. analysis_capture_and_analyze — captured 8,192 samples per
channel at 1 MS/s.
Assistant: Both scope channels show only a flat noise floor (roughly −0.07 to −0.03 codes, RMS 0.05) — there's no signal on the inputs. Want me to start the signal generator and capture again?
Note
Everything the assistant does is an ordinary operation: each step shows up in the application window as it happens, appears in the log, and can be captured in a recording — an agent session leaves the same trail as a person at the keyboard.
Staying in control
- Local by default. The API only accepts connections from your own machine and has no authentication — leave Allow Remote Connections off unless you are on a trusted network and need it.
- Scope what agents can touch. The Scripting tab's toggles are levers: turn off Enable Transaction Tools and the assistant can no longer operate the application or hardware (screenshots can be left on for a look-but-don't-touch setup).
- Supervise hardware work. Tools that write to hardware are marked destructive as a hint to the assistant, not a lock — keep an eye on the app while an agent works on a live board, exactly as you would with a colleague at your bench.
Troubleshooting
| Symptom | Cause | Fix |
|---|---|---|
| Tools error with "Evaluation Studio is not running" | The app is closed; the proxy stays available and says exactly this | Ask the assistant to run app_launch (or start the app yourself) |
| Assistant connects but tool calls fail against a running app | The app was started by you with the HTTP API disabled | Enable HTTP API and MCP Server in Settings → Scripting, or let the agent launch the app instead |
| You changed the HTTP port and the connection broke | The proxy defaults to port 28282 | Re-copy the snippet from Connect an AI client — it adds the right port automatically |
| The panel warns the proxy binary is missing | Running a development build that hasn't packaged the proxy | Build the full solution once, or use an installed copy of Evaluation Studio |