Evaluation Studio
Evaluation Studio is Analog Devices' desktop platform for evaluating ADI hardware: connect an evaluation board, configure it, capture data, and analyse the results.
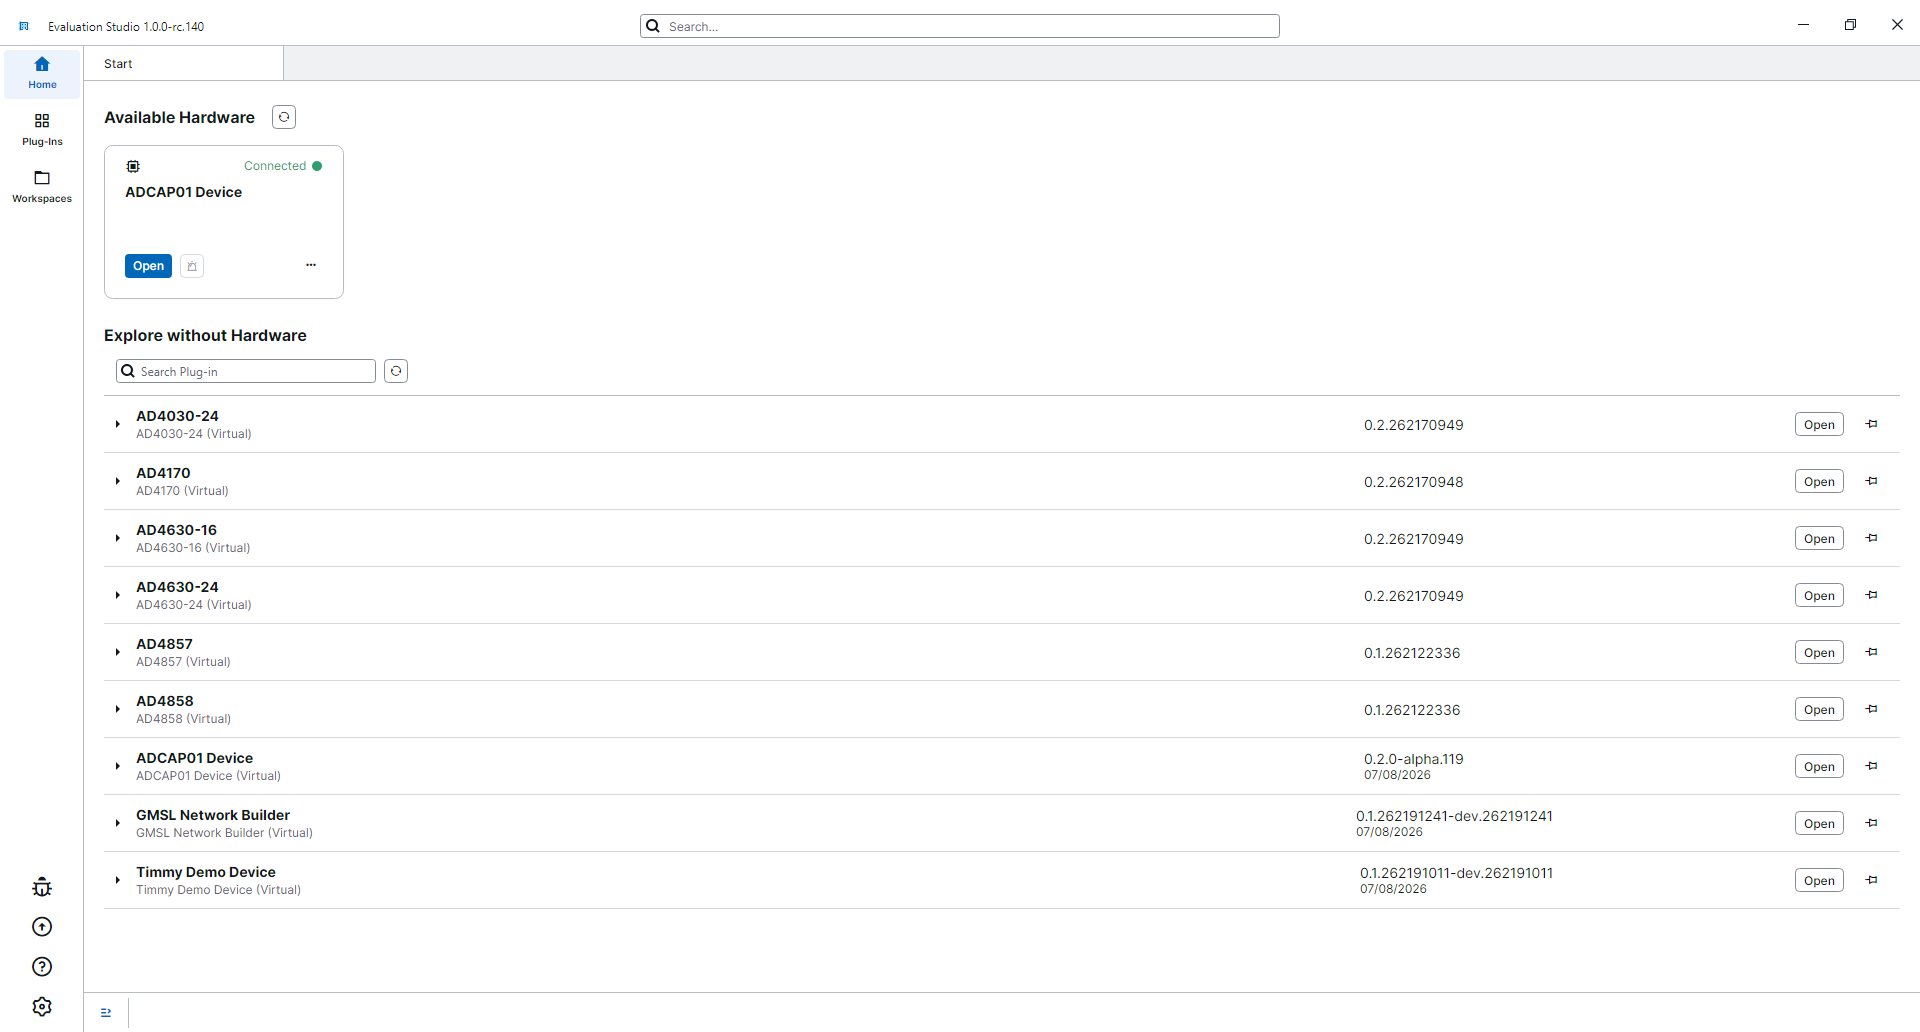
The Home screen. Connected boards appear under Available Hardware; anything you have installed can also be opened without hardware.
What you can do
| You want to | Where it happens |
|---|---|
| Configure a device | Its device pages, or the register-level Memory Map |
| Capture and measure | Analysis — waveform, spectrum and histogram views with a results table |
| Keep or share a setup | Workspaces store devices and configuration state; Recording stores the steps you took |
| Work without a bench | Open any installed device in virtual mode |
| Add or update device support | Plug-in Management |
| Automate | Scripting, or an AI assistant |
| Diagnose a problem | Logs, then Report an Issue |
How it works
Device support ships as a plug-in — a package containing everything Evaluation Studio needs to work with a device or device family. A single plug-in can cover several parts, so check its supported devices in Plug-in Management.
Connecting a board is plug-and-play. A board that Evaluation Studio recognises appears on the Home screen, where its button reads Open if the plug-in is already installed, or Install if it is not. Choosing Install downloads the plug-in and its dependencies; the button then reads Open.
Detection relies on the board identifying itself, which not every board supports. Where a connected board does not appear, or appears marked (Unknown) because no installed or available plug-in covers it, search for new plug-ins by part number or board ID — from the title bar, or in Plug-in Management. Either search works with no hardware connected, so you can confirm that a part is supported before the board arrives.
The main window at a glance
| Where | What it is |
|---|---|
| Title bar | Name, version, and a search box that finds devices and plug-ins by name, description or board part number |
| Left rail, top | Home, Plug-Ins, Workspaces |
| Left rail, bottom | Report an issue, Updates, About, Settings |
| Tab strip | Start, plus one tab per open device |
| Explorer | The pages the open device offers |
| Bottom panel | The log and the recorder — the first place to look when something misbehaves |
Where to go next
Start with Setup to install the application and its drivers, then Quickstart to go from a connected board to a captured waveform. For anything beyond a first evaluation, pick the task from the table above.
Getting help
About, at the bottom of the left rail, shows your version — quote it in any support request — and links to the documentation, release notes and support.
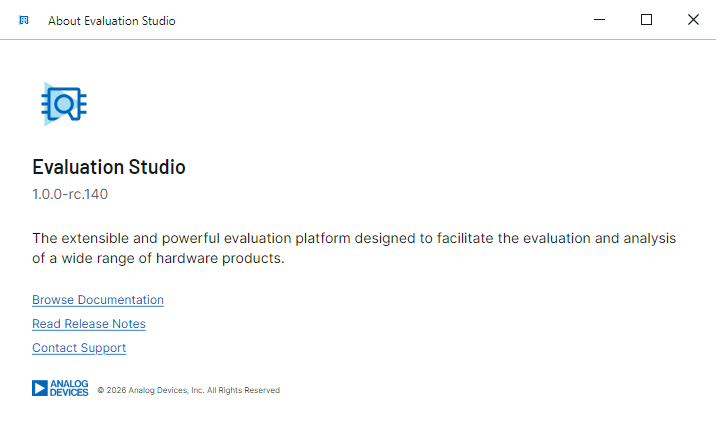
For a defect, see Report an Issue.
Related
- Setup — install the application and its drivers.
- Quickstart — a first evaluation, start to finish.
- Plug-in Management — where device support comes from.
- Settings — preferences, repositories and automation options.