Capture and analyse data
Use the built-in Analysis features to capture data from your device and analyse it using the available Analyzers. In almost all cases, the device will need to be launched using the Attached Hardware tiles along with hardware present to capture data. The Analysis view can vary by device.
Before you start
- Open a device from the Start tab.
- Check the Explorer tree on the left for an Analysis entry. Not every device has one, and it could be named something else. Refer to the device's documentation.
Open the Analysis view
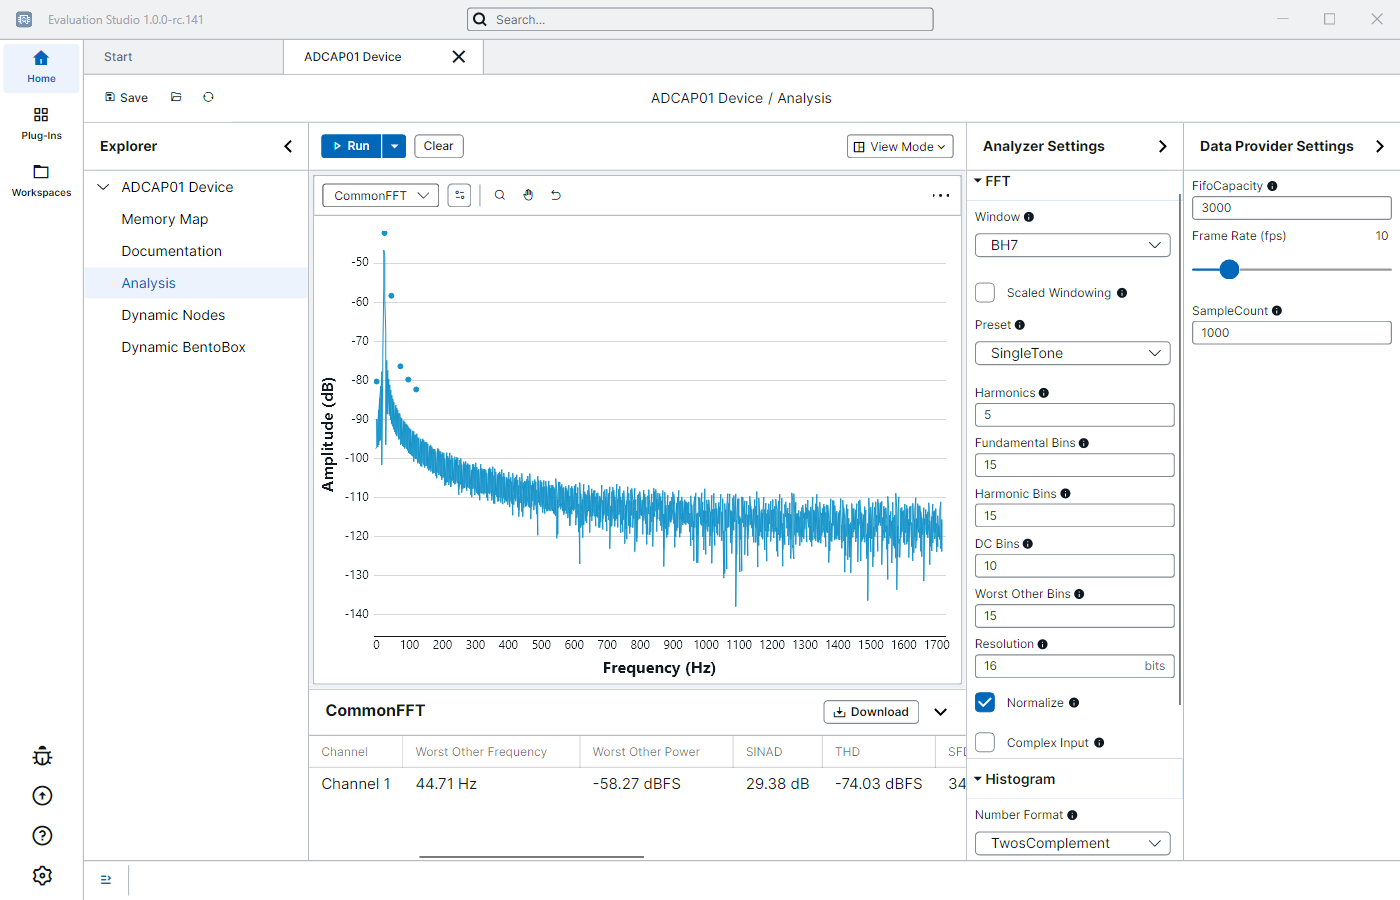
Click the Analysis entry in the Explorer tree. The view opens with a single chart and an empty results table below it.
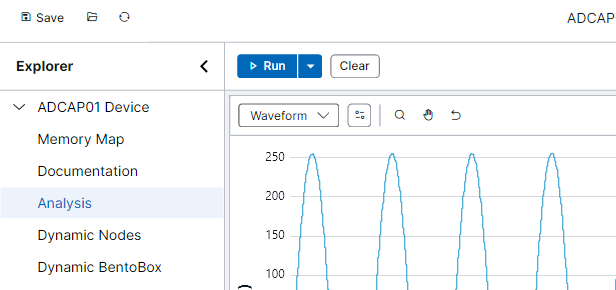
Nothing is captured until you press Run.
Run a capture

| Button | What it does |
|---|---|
| Run | Captures data once, then analyses it. |
| Arrow next to Run | Switch between Run Once and Run Continuously. |
| Stop | Appears in place of Run during a continuous capture. Click it to stop. |
| Clear | Discards the captured data and empties the charts and results. |
Press Run. The charts fill in and the results table below them lists one row per channel.
What repeated presses of Run do depends on your device and your settings. Some replace the data each time. Others add to it, so the waveform grows until the buffer is full and the oldest samples drop off the end.
Choose what a chart shows
Each chart has its own dropdown on the left of its toolbar. Use it to pick the analysis the chart shows.

The standard analyzers are Waveform, CommonFFT, and Histogram. For what each one plots and the results it reports, see Standard Analyzers.
Displaying more than one chart
Click View Mode on the right of the toolbar to pick a layout, with up to four charts visible at once. New charts fill themselves in with whatever analyses aren't on screen yet.
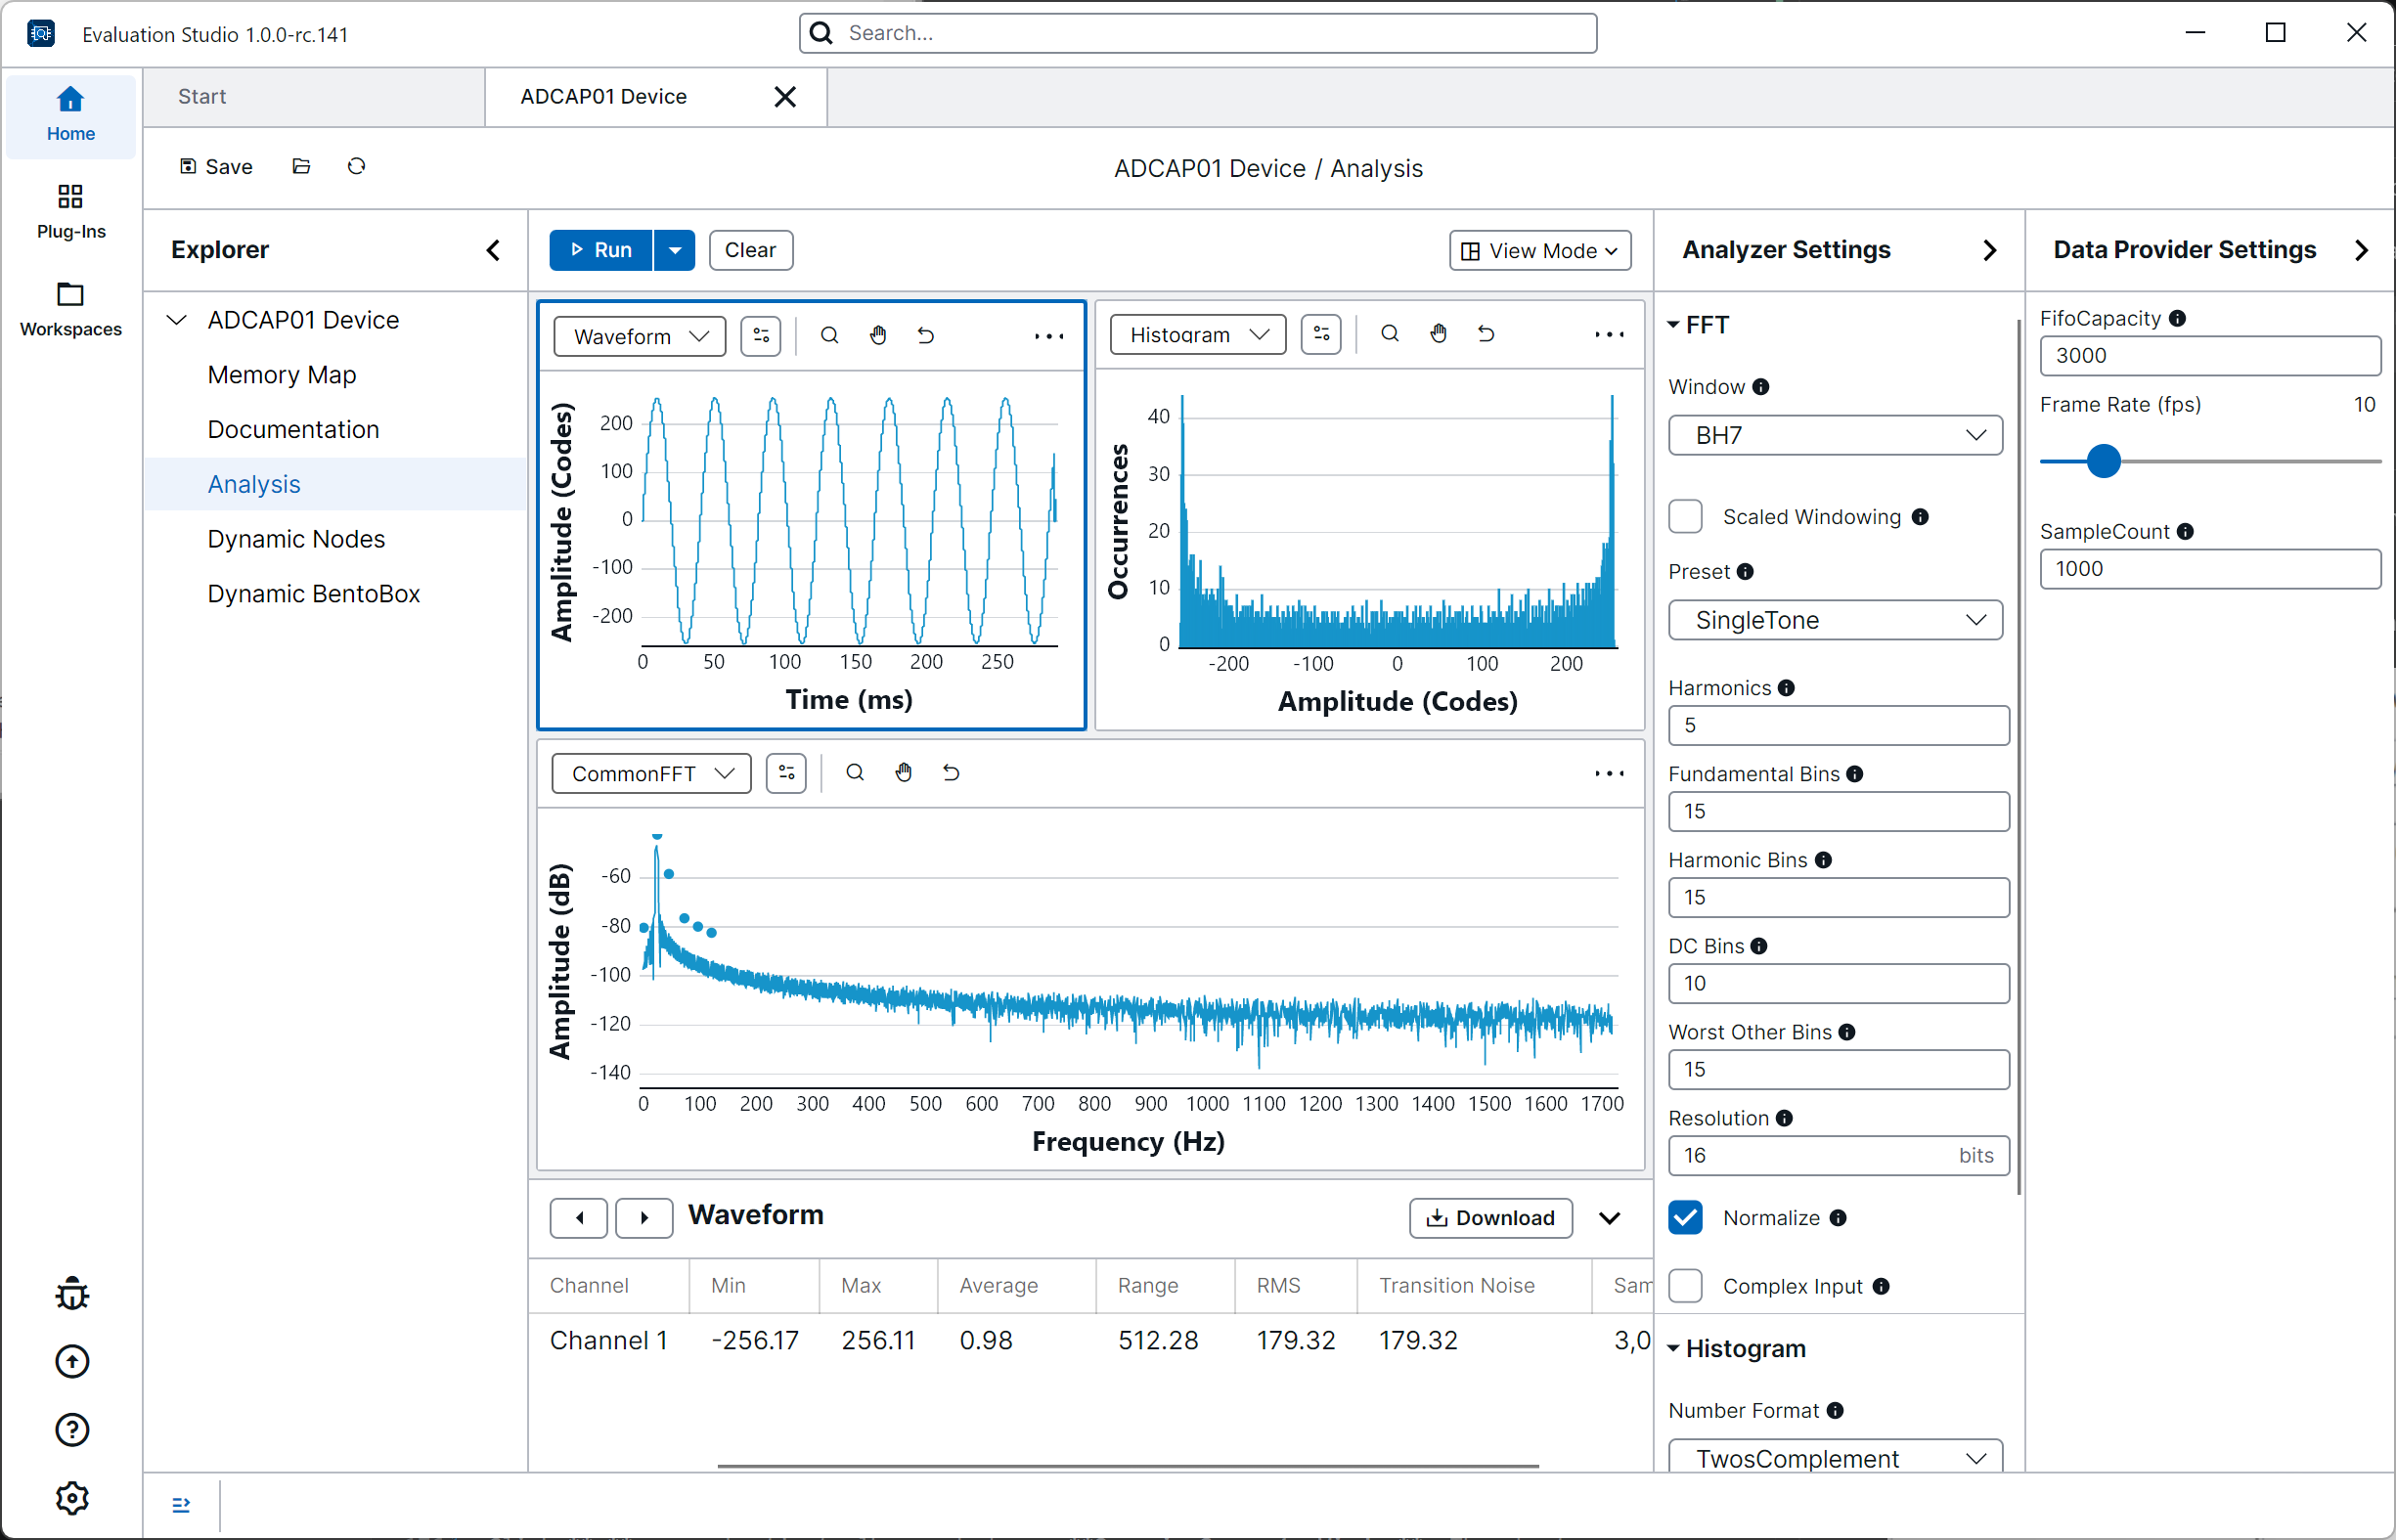
In a multi-chart layout, click a chart to select it. The selected chart is outlined, and the results table follows your selection. The ‹ and › buttons in the results header step between charts.
Read and filter the results

The table shows results for the selected chart, one row per channel. Click a column heading to sort by it. Drag the edges to resize columns, or drag a heading to reorder them. The Channel column stays in place.
To hide a channel, click the Toggle Channels button on the chart's toolbar and untick it. This hides its line on the chart and its row in the table, for that chart only. Other charts keep showing it.
Use the chevron on the right of the results header to collapse the table and give the charts more room. To resize it instead, drag the divider between the charts and the table.
Zoom and pan
| Button | What it does |
|---|---|
| Zoom | Drag a box on the chart to zoom into it. |
| Pan | Drag to move around the chart. This is the default. |
| Reset Chart View | Fits the chart back around all of the data. |
You can also scroll the mouse wheel to zoom, and double-click to fit.
During a continuous capture, the chart refits itself around new data as it arrives. Zooming or panning by hand stops this, so your view stays where you left it. Click Reset Chart View to resume automatic fitting.
Configure your analysis
You can configure your analysis using the options that the plug-in provides. Each device will have its own set of configuration options for you to use.
Look for the collapsible panels on the right of the view. Click a panel's heading to open or close it.
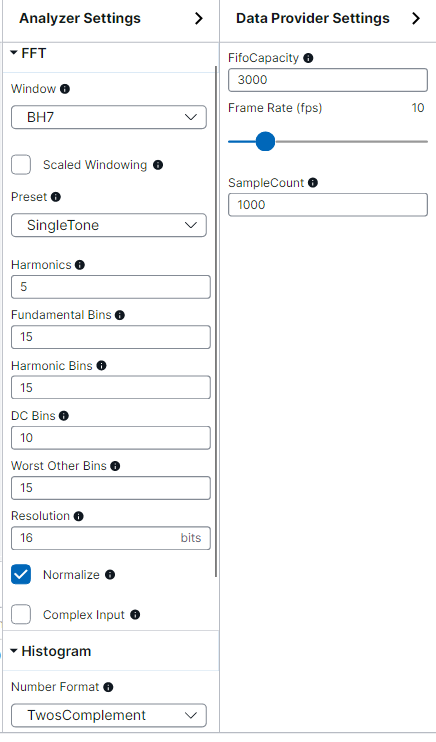
The example above is the ADCAP01 demo device, which provides a Data Provider Settings panel for how much data to capture, and an Analyzer Settings panel for how to analyse it. Hover over the i beside an option to see what it does.
Changes apply to the next capture rather than to data already captured. Press Run again for them to take effect.
Export
To export the data and results of the active capture as files on your computer:
- Click Download in the results header.
- Pick a folder.
You get two CSV files per analysis: one with the results table, one with the chart data. A message appears when the export is complete, with a button to open the folder.
To save a picture of a chart, click the three dots … on its toolbar and choose Export as Image, then pick a format in the save dialog. Right-clicking the chart offers the option.
Open a chart in its own window
Click … on a chart's toolbar and choose Open in Separate Window. The chart moves into its own window, which you can resize or drag to another monitor. To return it to the Analysis view, choose Open in Analysis from the same menu.
Related
- Standard Analyzers — what Waveform, CommonFFT, and Histogram each plot, and the results they report.
- Memory Map — change a register, then run another capture to see the signal change.
- Scripting — run captures and exports without the UI.
- Logs — where errors from a failed capture appear.