Inference Results
Once inference is complete, results are displayed for each input file to help users analyze model accuracy and performance.
Deploy and inference pane
This pane lists all past inference sessions related to this project build, including the date and time of creation. The most recent session is automatically shown, and you won't see any inference sessions from another project.

-
To initiate a new inference, click Start New Inference. This action redirects the user to Step 1 – Device Selection.
-
Use the Dropdown Menu to view and select past inference sessions and click the Proceed icon to load the specific inference session.
-
Click the Export Inference button to download the file containing information such as output data, source data, and real output.
-
Click the Download PDF button to get a copy of the Build Summary.
Input files pane
This pane shows the files used as input for this inference session. By clicking each individual input file, users can see the corresponding inference result or output.
To manage the files, click Edit Files.


-
Remove all files at once by clicking Delete All.
-
Click Cancel to stop editing the files.
-
Delete individual files by clicking on the Trash icon.
Inference results pane
The interface adapts based on the type of AI model used. Supported result types include:
- Vision
- Audio
- Time-Series
Users can resize the pane using:
- Expand icon – enlarges the pane and reveals the Export Results button. This action also hides the build setup side pane.

- Collapse icon – reduces the pane size.

All result views also display Device Performance Metrics, as shown in the table below.
| Flag | Description | Unit |
|---|---|---|
| Latency | The length of time it took for the device to process the data. | μs |
| Power | The amount of energy the device used to perform the inference. | mW |
| Memory | The size of the model used to store the data of this specific inference result. | kb |
Model-specific result views
Vision inference results
Vision inferences are categorized into:
-
Classification (Image Classification and Image Segmentation)
Identifies the primary object(s) in an image and returns a label with a confidence score.
Example
Example 1: Image Classification

Example 2: Image Segmentation

-
Detection (Visual Wake Work, Face ID, and Object Detection)
Combines classification with object localization using bounding boxes.
Example
Example 1: Object Detection

Example 2: Visual Wake Word

Vision Viewer Controls (from left to right):

-
Drag the Results Screen – Turn on the ability to click and drag the image area to move around when zoomed in
-
Zoom Out – Reduces the image size to see the full image or larger context.
-
Zoom In – Enlarges the image to view finer details more clearly.
-
Maximize Window – Expands the image results panel to full screen for better visibility.
-
Zoom Percentage – Displays the current zoom level of the image (e.g., 100%, 200%).
The Results Section shows model predictions, confidence scores, and device performance metrics.

Audio inference results
Audio inferences are categorized into two parts:
-
Denoiser (Before-After)
Compares original and processed audio using two synced players: Input and Output.
Example
Denoiser

-
Detection (Keyword Spotting and Genre Identification)
Identifies spoken keywords or music genre with confidence scores using a single audio player.
Example
Keyword Spotting

Audio Viewer Features:
-
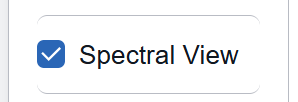
Spectral View
Displays the spectogram which represents the frequency content as it varies with time.
-
Headphone Icon
Indicates active playback.
-
Drag Bar (Seek Bar / Timeline Cursor)
Allows the user to click and drag the vertical line on the waveform to move to a specific timestamp in the audio.

Audio Player Controls (from left to right):

-
Backward (Rewind) – Moves the playback position backward.
-
Stop – Stops the audio and resets playback to the beginning.
-
Play – Starts playing the selected audio file from the current position.
-
Pause – Temporarily stops the audio playback while keeping the current position.
-
Forward (Skip Ahead) – Moves the playback position forward.
Time-series inference results
Time Series inferences are separated into two categories:
-
Point Anomaly Detection - where the anomalies in the data are only marked as various red dots in the graph.
-
Region Anomaly Detection – where an entire section of the graph is marked red.
The Time Series inference results will show two graphs:
-
Input vs. Timestamp – Input Represents the raw signal or data values fed into the system or model. Timestamp represents the time at which each input value was recorded. Together, they help visualize how input data changes over time.

-
Mean Squared Error (MSE) Loss vs. Timestamp – represents the difference between predicted and actual values. When plotted against Timestamp, it shows how model error changes over time.

MSE Loss Threshold
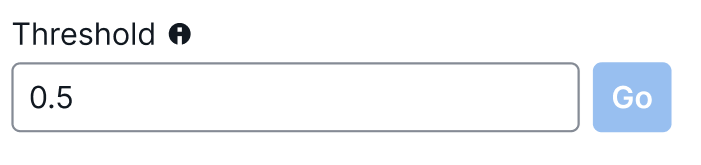
An MSE loss threshold is a cutoff value that defines the maximum acceptable prediction error for the model.
The default value is 0.5 and you can set the value in the Threshold field.
Note
The threshold value for each input file has to be applied independently, and refreshing the page will set all the values back to default.
Important
When exporting the CSV file, the default 0.5 threshold value will be used. Users can only edit the data after it has been exported.
Legend – X Channel, Y Channel, Z Channel Checkboxes

These checkboxes allow users to show or hide specific signal channels.
-
X Channel – Displays X-axis signal data.
-
Y Channel – Displays Y-axis signal data.
-
Z Channel – Displays Z-axis signal data.
Enable or disable a channel by clicking on its respective box to easily differentiate between the plots/lines.
Time-Series Graph Controls (from left to right):
-
Pan – Turn on the ability that allows users to move the graph left, right, up, or down without changing the zoom level.
-
Zoom Out – Reduces the image size to see the full image or larger context.
-
Zoom In – Enlarges the image to view finer details more clearly.
-
Maximize Window – Expands the image results panel to full screen for better visibility.
-
Zoom Percentage – Displays the current zoom level of the image (e.g., 100%, 200%).