The age of AI is changing embedded development at its foundations. The defining challenge will not be whether we can place larger models on smaller devices, or whether silicon can execute more operations per watt. The defining challenge will be whether engineering teams can understand the behavior of intelligent systems deeply enough to trust them in the real world. At the edge, AI does not run in isolation. It shares memory, timing, power, peripherals, execution resources, interrupt paths, communication stacks, real-time firmware, operating systems, and heterogeneous cores. The result is a new class of embedded system: silicon aware, adaptive, concurrent, resource-constrained, and increasingly difficult to reason about through traditional debugging alone.
The IDE of the AI era is no longer a single-purpose tool. It is a central platform that orchestrates toolchains, hardware interfaces, and workflows across multiple entry points, including UI, CLI, MCP, and agent-based systems. It must become an observability and reasoning layer for the system itself, connecting source code, build artifacts, live target state, runtime behavior, and AI-assisted investigation into one coherent workflow. Debugging becomes a continuous discipline of understanding rather than a reactive step after failure. Every interaction with the system contributes to a growing body of evidence that links silicon behavior to engineering decisions.
From Debugging Tools to a Unified Observability Ecosystem
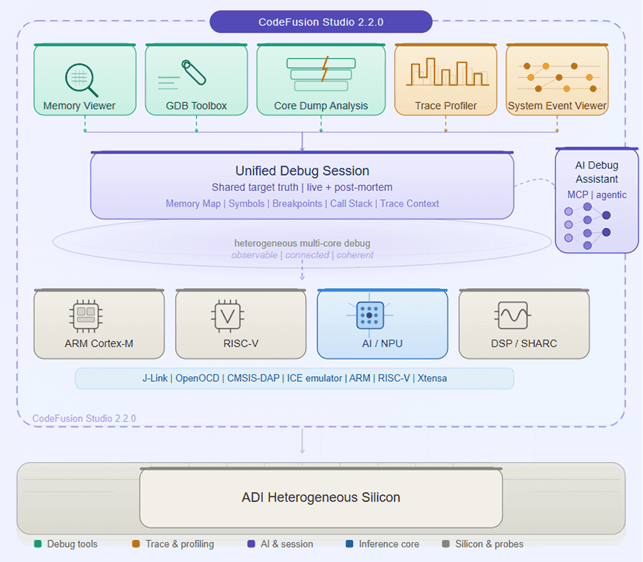
CodeFusion Studio™ 2.2.0 (CFS) moves toward this model by establishing a unified debug and observability ecosystem for ADI silicon. Its value is not simply the presence of individual tools, but the architecture that connects them. Each capability operates on a shared debug session foundation, where target state, memory, symbols, and execution context are consistent across the system.
In complex embedded environments, the biggest challenge is not lack of data, but fragmentation. Tools can produce useful outputs, but disconnected views force engineers to reconstruct system behavior manually. CFS addresses this by grounding every tool in a shared target truth. This architectural coherence becomes essential in the age of AI, where both engineers and intelligent systems rely on consistent, trustworthy evidence.
AI-assisted engineering only works when the assistant is grounded in real system context. Without that, it is simply generating plausible explanations. With it, AI becomes a practical investigative layer over live hardware. The goal is not to replace engineering judgment, but to accelerate it by reducing the gap between observation and understanding.
Opinions expressed in the content posted here are the personal opinions of the original authors, and do not necessarily reflect those of Analog Devices, Inc (ADI) or its subsidiaries. The content is provided for informational purposes only and is not meant to be an endorsement or representation by ADI or any other party. This site may also provide links or references to non-ADI sites and resources. ADI makes no representations, warranties, or other commitments whatsoever about any non-ADI sites or third-party resources that may be referenced, accessible from, or linked to this site.
Memory Viewer: Making Silicon State Observable
The CFS Memory Viewer provides a direct view into the system’s physical state. It presents live memory with explicit indication of whether the data is current or stale, ensuring engineers always understand the context of what they are inspecting. This distinction becomes critical in complex systems where incorrect assumptions about state can mislead debugging.
In heterogeneous environments, the Memory Viewer tracks multiple debug sessions and adapts context as engineers move across cores. It also supports post-mortem analysis, allowing crash state to be inspected in read-only form with clear labeling. This continuity between live and retrospective analysis allows engineers to reason about failures using the same mental model regardless of when the failure occurred.
GDB Toolbox: Turning Expertise into Shared Knowledge
The GDB Toolbox captures debugging expertise and makes it reusable. Instead of relying on individual knowledge of complex command sequences, teams can use predefined scripts to perform common investigations such as fault decoding, stack analysis, and thread inspection.
These workflows are defined in structured, version-controllable formats, allowing teams to evolve and share debugging knowledge over time. This transforms debugging from an individual skill into a collective capability, ensuring consistent analysis across teams and projects.
Core Dump Analysis: Preserving Failure as Evidence
Core Dump Analysis extends debugging beyond live sessions by treating failures as durable evidence. When issues occur in the field or under difficult-to-reproduce conditions, core dumps can be captured and analyzed later within a full debug environment.
CFS enables retrieval of core dumps and reconstruction of system state, including fault causes, stack traces, and memory context. This allows engineers to investigate failures without immediate reproduction, making debugging more resilient and scalable across real-world deployments.
Trace Profiler: Watch Your System Think in Real Time
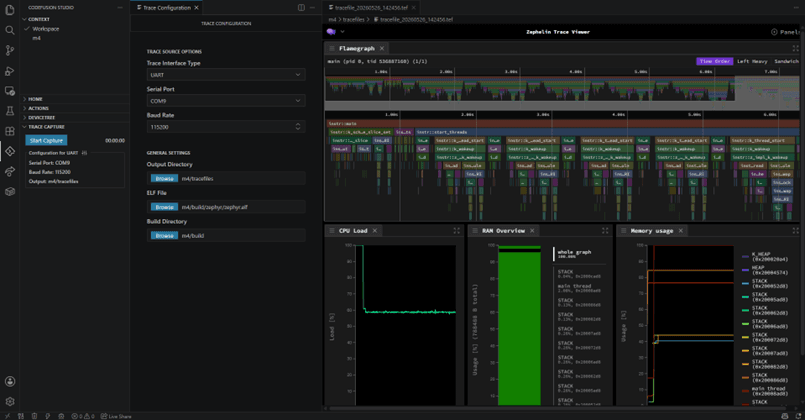
Register dumps tell you where the processor stopped. Profiling tells you what it was doing while it ran. CFS integrates the Zephelin trace profiler-a middleware layer developed in collaboration with Antmicro-that provides runtime statistics for CPU and memory usage, and instruments Zephyr RTOS at the kernel level: detailed application execution, function by function, with no changes required to the source code. Enable AI model profiling and Zephelin captures operator-level TensorFlow Lite Micro inference metrics-per-layer cycles, latency, energy, and arena memory usage-giving you the data to optimize inference on resource-constrained silicon.
Trace capture runs directly from the CFS sidebar. Select your serial port, hit start, and the system streams Common Trace Format data from the target. CFS converts CTF to Trace Event Format using the Zephyr ELF for symbol resolution, producing interactive visual timelines that map real-time system behavior back to your source code. For edge AI applications running on ADI’s MAX78000 and MAX78002-processors purpose-built for ultra-low-power neural network inference-this is the difference between guessing at latency and measuring it down to the operator.
System Event Viewer
System-level visibility is essential for understanding interactions across complex embedded systems. Event and trace views provide a timeline of system behavior, allowing engineers to correlate activities across software, hardware, and AI workloads.
This enables engineers to move from isolated observations to a more complete understanding of system behavior. In AI-enabled systems, this visibility provides the foundation needed to interpret interactions that would otherwise remain opaque.
AI Debug Assistant: Real-Time Conversations with Silicon
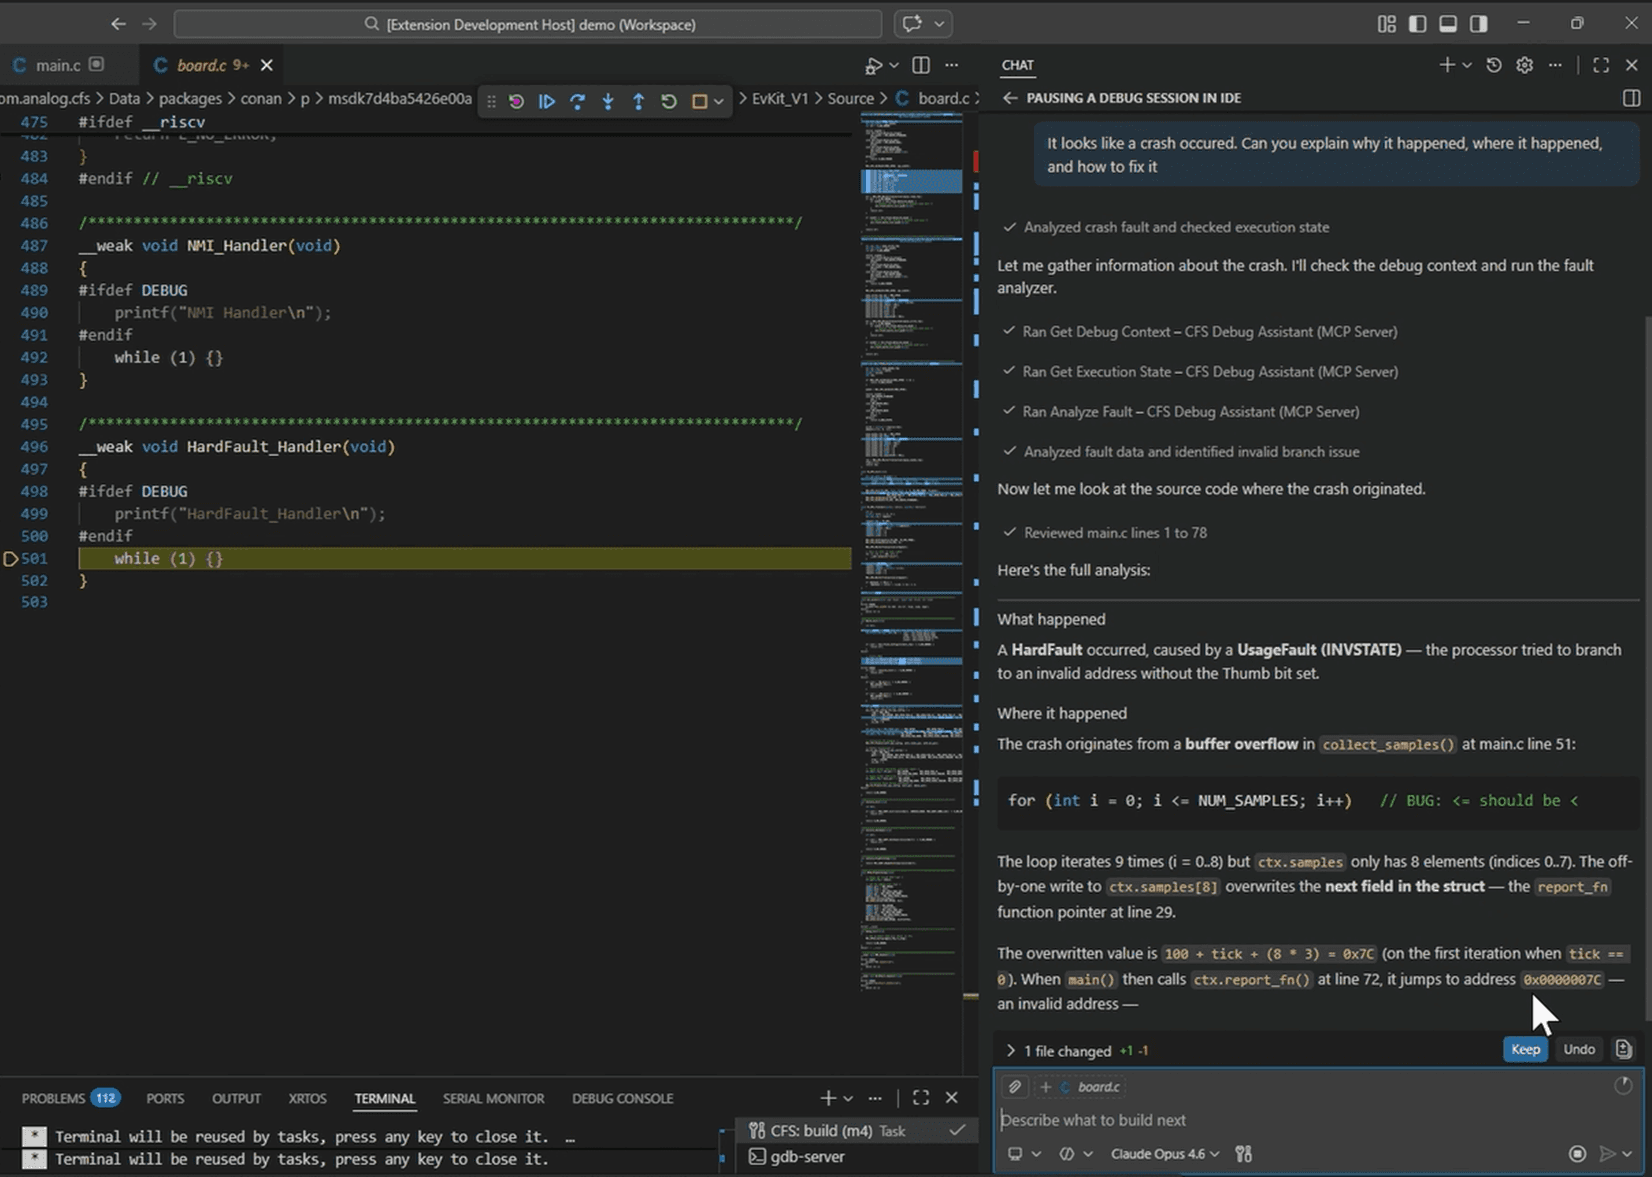
The AI Debug Assistant is the most explicit expression of this direction in CFS 2.2.0. Built on the Model Context Protocol, it connects directly to a live debug session on real hardware and operates on real system context. It can inspect registers, memory, execution state, and source, enabling guided investigations through natural language. These are not generic chatbot interactions - they are tool-mediated investigations over live embedded state.
Its value lies in how it complements the debugging process. The assistant helps navigate complex systems, identify relevant signals, and accelerate hypothesis formation, while remaining grounded in the same evidence available to the engineer. This ensures that insights remain transparent and verifiable. The assistant operates within explicit safety boundaries, with destructive commands blocked at the protocol level, making AI participation in hardware-connected workflows safe by design.
CFS exposes the assistant through @cfs-debug inside VS Code Copilot Chat and through an MCP server over HTTP for compatible clients. More than twenty debug tools are available through the protocol, enabling workflows such as crash diagnosis, memory corruption investigation, conditional breakpoint analysis, and step-level inspection. A deeper exploration of this approach is covered in “Introducing Agentic AI Workflows as an Embedded Debugging Partner in CodeFusion Studio”
Most importantly, the AI Debug Assistant shares the same unified session layer as the rest of the debug ecosystem. It operates on the same target connection, memory map, and execution context, ensuring that AI-assisted reasoning is always grounded in consistent system evidence rather than a separate interpretation of the system.
Heterogeneous Multi-Core: One IDE, Every Core, Full Visibility
Modern embedded systems are inherently heterogeneous. Different cores perform different roles, from real-time control to AI inference. Historically, debugging across these systems required multiple tools and manual correlation.
CFS provides a unified environment where multiple cores can be debugged simultaneously within a coordinated session. Engineers can inspect execution, memory, and system state across architectures without switching tools or losing context. This provides a cohesive view of system behavior and simplifies debugging of interactions that span cores.
Toward an AI-Era Debug and Observability Platform
CFS 2.2.0 represents a shift toward a more integrated model of embedded engineering. Each capability contributes to a larger system of observability, where state, behavior, and failure evidence are connected and accessible.
This foundation becomes increasingly important as embedded systems evolve toward agentic workflows and autonomous software pipelines. As AI-driven development and debugging workflows mature, both engineers and intelligent agents will depend on consistent, structured access to system state, execution data, and debugging context. The role of the development environment expands from tool integration to orchestration of these workflows.
Conclusion: From Complexity to Clarity
The future of embedded development will belong to environments that turn complexity into clarity, accessibility and insights. As AI workloads move deeper into edge devices and heterogeneous architectures become the norm, engineering teams will require coherent systems of observability, automation, safety, and intelligence. CodeFusion Studio 2.2.0 provides that foundation by connecting debug, runtime insight, post-mortem analysis, system visibility, and AI-assisted investigation around a unified understanding of the target. This enables engineers to move beyond fragmented debugging toward a continuous process of understanding and optimization.
As agentic workflows and autonomous AI-driven embedded software pipelines emerge, this need becomes even more critical. Both engineers and AI agents will depend on structured, trustworthy access to system state and execution behavior. The development environment evolves into a shared interface where human reasoning and AI-guided investigation operate on the same evidence. This direction is explored further by David Perez in “Multi-Agent Zephyr Software Generation”. CFS is moving toward this future by establishing a platform where debugging, observability, and AI-assisted reasoning converge to make complex systems more transparent, explainable, and trustworthy.