blog
March 04, 2026
"Today, we're taking a step in a journey where AI can reason live with silicon - turning the embedded debugger from a passive inspection tool into an AI-driven system that can investigate, diagnose, and act alongside the engineer."
Over the past two years, AI has transformed how developers write software. Autocomplete, copilots, and chat-based Q&A have become standard tools, with millions of engineers now coding alongside AI every day. But once that software runs on real hardware, the workflow suddenly feels decades old: manually inspecting system state, digging through registers and memory dumps, poring over thousand‑page reference manuals, and instrumenting firmware with scattered print statements just to understand what’s happening on the device.
Studies estimate that embedded engineers spend 50% or more of their development cycle on debugging and testing[1]. For heterogeneous multi-core SoCs, that number climbs even higher[1].
This gap is most punishing where embedded systems are most complex: heterogeneous multi-core SoCs. Picture a modern application processor with an Arm Cortex-M55 host, a Cortex-M33 real-time core, and a dedicated DSP - each with its own memory map, its own interrupt architecture, and its own failure modes - sharing memory regions that neither core fully owns. A race condition between the real-time core's DMA engine and the application core's buffer management doesn't show up in a single stack trace. It shows up as an intermittent hard fault that vanishes when you add instrumentation. Tracking it down means coordinating multiple debug sessions, correlating timestamps across clock domains, and reasoning about bus arbitration timing that no amount of printf can capture.
Today, we're changing that. We're introducing the AI Debug Assistant in CodeFusion Studio - an agentic AI system that doesn't just answer questions about your code, but actively participates in your debug sessions, autonomously investigates faults across cores, and reasons about the physical state of your silicon in real time.
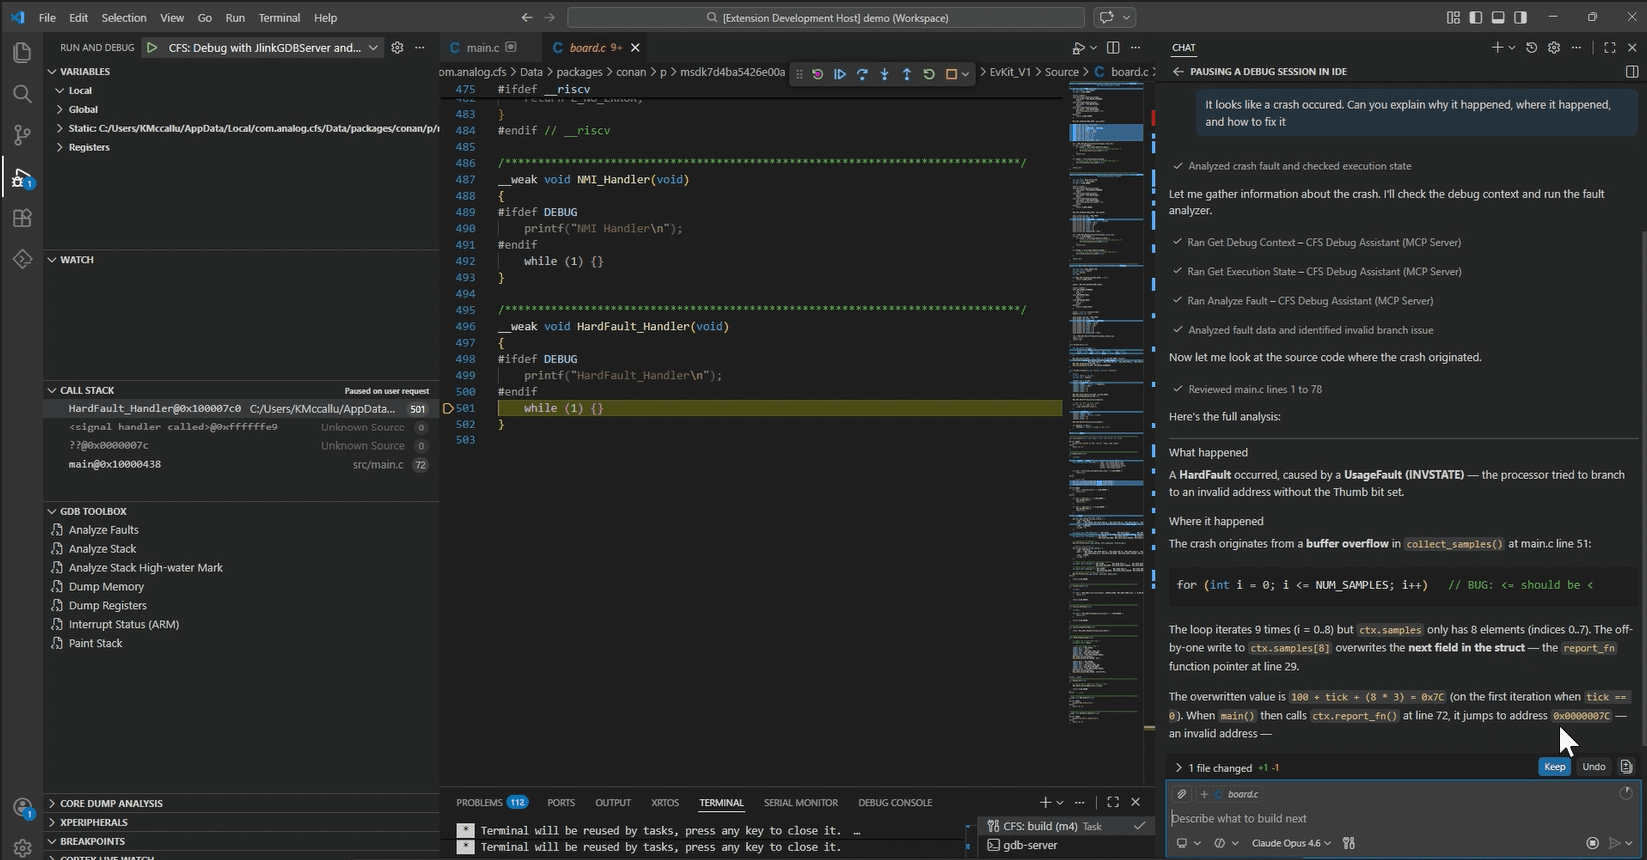
There is a meaningful difference between an AI that suggests the next line of code and one that can autonomously coordinate debug sessions across multiple cores, read fault registers on each, decode the exception frames, correlate a shared-memory conflict, and tell you that your DMA descriptor on Core 1 is racing against a buffer reallocation on Core 0 . The AI Debug Assistant bridges that gap.
Opinions expressed in the content posted here are the personal opinions of the original authors, and do not necessarily reflect those of Analog Devices, Inc (ADI) or its subsidiaries. The content is provided for informational purposes only and is not meant to be an endorsement or representation by ADI or any other party. This site may also provide links or references to non-ADI sites and resources. ADI makes no representations, warranties, or other commitments whatsoever about any non-ADI sites or third-party resources that may be referenced, accessible from, or linked to this site.
Built on the Model Context Protocol (MCP) - an open-source standard created by Anthropic that enables AI models to seamlessly connect with external data, tools, and systems - it gives any compatible AI client the ability to:
Capability | Description |
Live Debug Session Control | Start, stop, step, continue, pause, and restart, just as you would from the debug toolbar. |
Real-Time Hardware State Inspection | Read registers, memory, variables, stack traces, and thread lists directly from the target. |
Breakpoint & Watchpoint Management | Set conditional breakpoints and watchpoints without leaving the conversation. |
GDB Command Execution | Full GDB access with built-in safety guards that block destructive operations like quit, kill, or detach. |
Hardware Fault Decoding | Automatically parse ARM Cortex-M fault registers (CFSR, HFSR, BFAR, MMFAR) and RISC-V exception registers (mcause, mtval, mepc) into human-readable diagnoses. |
ELF Binary Analysis | Surface symbol sizes, stack usage, section layout, and the largest consumers of flash and RAM. |
Full Project Context Awareness | Understand pin configuration, clock trees, peripheral settings, SoC data models, installed packages, and toolchains. |
This isn't a chatbot bolted onto an IDE. It's a deeply integrated debugging partner with access to 23 tools and 10 pre-built diagnostic workflows - all exposed through a standardized protocol that any AI model can use.
An engineer is developing firmware on a dual-core SoC - a Cortex-M33 handling real-time sensor acquisition and a Cortex-M4 running application logic. The two cores share a region of SRAM for passing data. Under load, the application core intermittently reads stale or corrupted values from the shared buffer. There's no crash, no fault - just wrong data, and only when both cores are active.
The engineer types one sentence in Copilot Chat: "Investigate the shared memory issue between both cores." The AI Debug Assistant takes over. It connects to debug sessions on both cores. It reads the relevant memory region and inspects the variables mapped there via the ELF symbol table. It examines the state of each core - what each was executing, what addresses each was accessing - and identifies that Core 1's DMA transfer into the shared buffer overlaps with Core 0's read of the same descriptor. There's no synchronization primitive guarding access.
The assistant reports what it found: the specific memory region, the conflicting accesses, the source lines involved, and a suggested fix - a hardware semaphore guard around the shared descriptor.
This type of multi-core investigation - correlating state across debug sessions to find a subtle data-sharing issue - is exactly the kind of work that traditionally consumes hours of manual register inspection and instrumented rebuilds.
One of the most powerful aspects of the AI Debug Assistant is its library of diagnostic prompts - structured workflows that encode the kind of expertise that typically takes years of embedded development to build.
When you ask the assistant to diagnose a crash, it doesn't guess. It follows a systematic sequence: read the fault registers, decode the exception type, inspect the faulting address, walk the call stack, check the memory map for region violations, and cross-reference the ELF symbol table to identify the offending function. Each prompt is a repeatable, auditable investigation.
The current library includes workflows for:
Workflow | What It Does |
Crash Diagnosis | Systematic hard fault triage from fault registers to root cause. |
Memory Corruption Detection | Stack overflow, heap corruption, and buffer overrun analysis. |
Peripheral Misconfiguration | Cross-referencing live register values against pin, clock, and peripheral configuration. |
Multi-Core Debugging | Dual-core session coordination with shared-memory race condition detection. |
Core Dump Post-Mortem | Offline analysis of Zephyr core dumps without requiring a live target. |
Firmware Size Optimization | Flash and RAM analysis with actionable reduction recommendations. |
These workflows are just the starting point for a fully agentic SDLC. As the framework evolves, diagnostic prompts will no longer be isolated steps - they’ll become part of an autonomous reasoning chain. An agent that detects a crash will immediately launch deeper investigations: validating memory integrity, reviewing peripheral configuration, and synthesizing a vetted fix. Engineers won’t need to guide each step; the system will proactively analyze, correlate, and propose solutions, amplifying productivity and accelerating time to root cause.
We made a deliberate architectural choice: the AI Debug Assistant is built on the Model Context Protocol - an open standard for connecting AI models to external tools and data sources. This means it isn't locked to a single AI provider or a single interface. Today, it works with VS Code GitHub Copilot (via both the chat participant and Agent Mode) and Claude Code. Tomorrow, it will work with whatever AI client your team adopts. The protocol is the same; the tools are the same; the debugging intelligence is the same.
For teams building their own AI workflows, the MCP server is a building block. It runs as a local HTTPs service inside CodeFusion Studio, exposable on a configurable port, and every tool, resource, and prompt is discoverable through the standard MCP handshake. If you can send a JSON-RPC request, you can drive a debug session.
At Analog Devices, we believe intelligence is getting physical. The AI Debug Assistant is a concrete step toward truly agentic embedded workflows - where AI doesn't just respond to questions but autonomously orchestrates multi-step investigations, correlates hardware state across subsystems, and closes the loop from diagnosis back to code.
An embedded debug session is, at its core, a conversation between software and physics. Clock frequencies, voltage levels, signal integrity, bus arbitration - these aren't abstractions. When the AI Debug Assistant reads a peripheral register and cross-references it against the SoC data model, it's reasoning about the physical configuration of silicon. When it coordinates fault analysis across a heterogeneous multicore system, it's doing something no general-purpose coding assistant was designed to do.
This is the first time a large language model can directly interrogate live silicon state through a structured protocol.
That sentence is worth pausing on. It means an AI model can now read the hardware's own diagnostic telemetry, correlate it against the project's configuration and binary layout, and reason about what the silicon is actually doing - not what the source code says it should be doing. This is where embedded AI assistance diverges fundamentally from general-purpose coding tools. It's not enough to understand the language. You have to understand the machine.
The vision ahead is clear: agentic systems that can investigate a fault, propose a fix, verify it against hardware constraints, and - with the engineer's approval - apply it. Debug sessions that learn from previous investigations. AI that understands not just your code, but your board, your clocks, your power domains, and your signal chain. We're building toward that future, and the AI Debug Assistant is the foundation.