blog
March 31, 2026
AI Debug Assistant: Agentic Debugging
Accelerating Embedded Debugging with Agentic AI

Embedded debugging is one of the most time-intensive parts of software development requiring precision, deep system knowledge, and repeated low-level interaction with debug tools.
The AI Debug Assistant in CodeFusion™ Studio introduces a new way to interact with live debug sessions. It enables agentic workflows driven by natural language while preserving direct access to trusted debug infrastructure.
Natural Language Control of Live Debug Sessions
The AI Debug Assistant allows developers to describe what they want to do rather than manually issuing GDB commands or navigating complex debug UIs.
For example: “Set a breakpoint where the LED switches on, continue to it, then print the register values.”
The assistant translates this into executable actions against a live debug session - automating common workflows and accelerating root-cause analysis without abstracting the underlying tools.
Two Workflows, One Architecture
The AI Debug Assistant supports two streamlined ways to interact with embedded debug sessions, both built on the same underlying debug infrastructure.
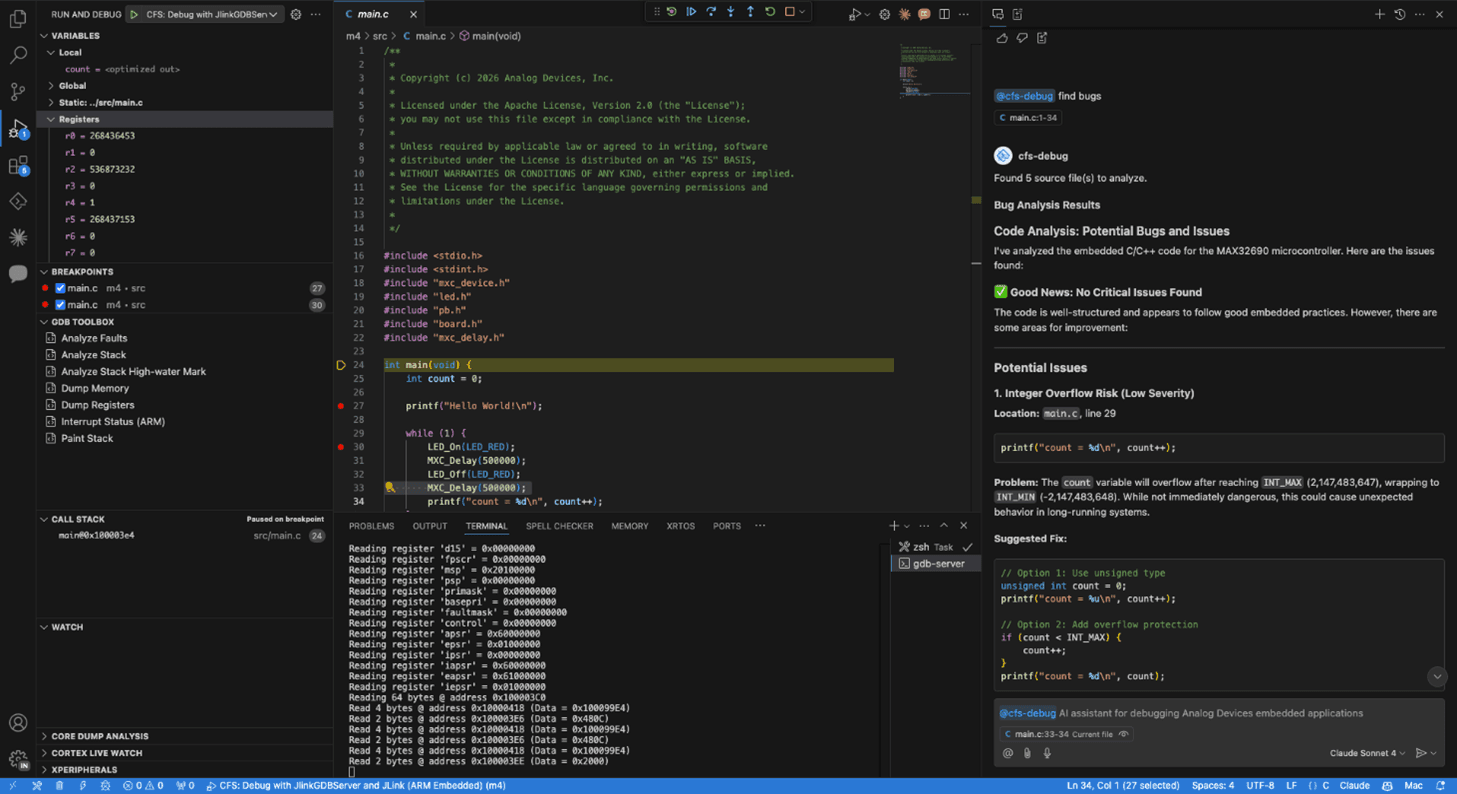
@cfs-debug in GitHub Copilot Chat
The @cfs-debug chat participant in GitHub Copilot Chat enables fast, deterministic execution of common debug tasks such as breakpoints, session control, and inspection.
- Recognized commands execute directly without invoking an LLM.
- For higher-level queries, the assistant gathers live GDB and workspace context, invokes an LLM, and returns analysis grounded in real system data.
The @cfs-debug chat participant routes your natural-language input to the appropriate debug operation. For direct commands - stepping, setting breakpoints, reading registers - it pattern-matches your message and executes the corresponding action immediately.
For analytical questions, it gathers relevant debug context from the live session (registers, variables, stack traces) in a single pass and sends it to the AI model, which returns an explanation grounded in the actual hardware state. Describe what you want to inspect or understand, and the assistant will gather the right context and respond.
MCP Server for Agentic Workflows
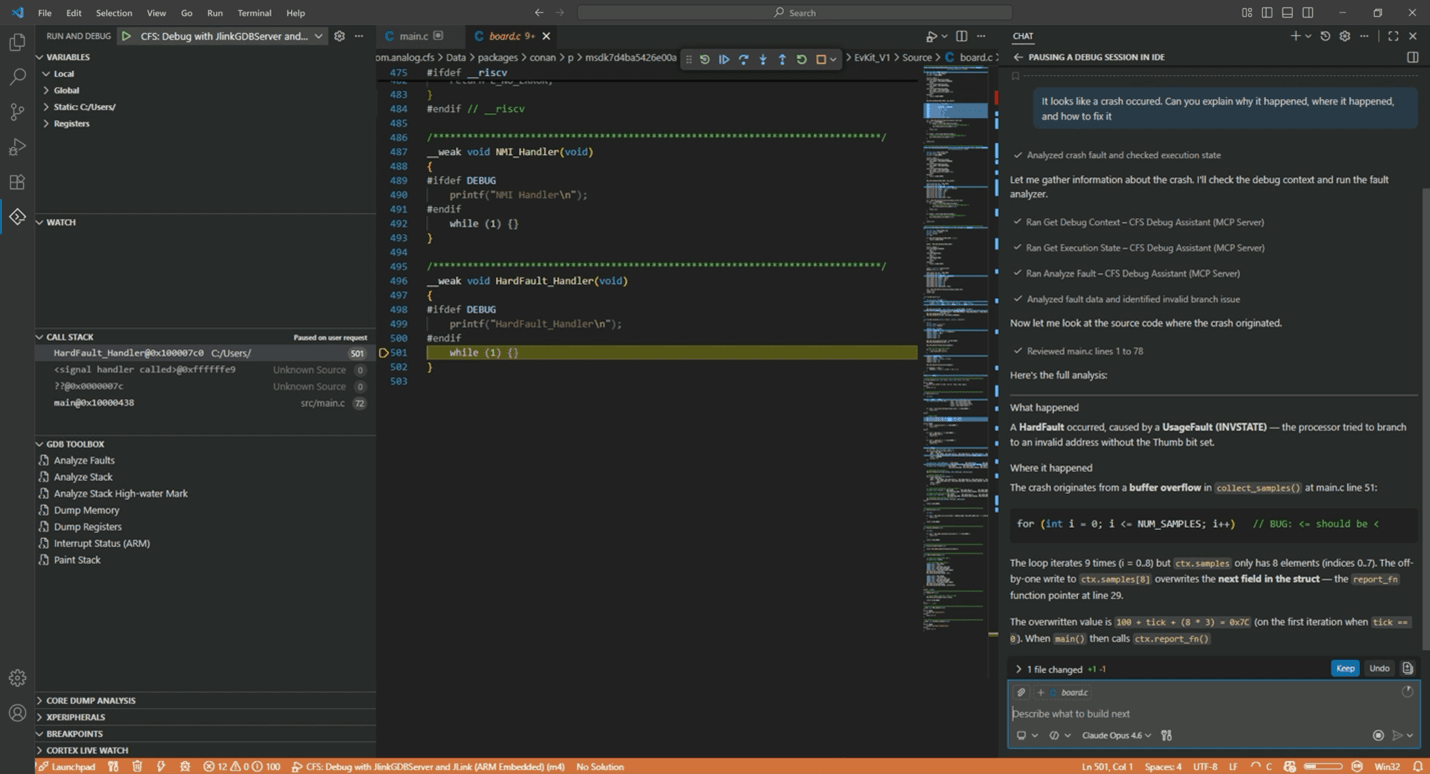
The Model Context Protocol (MCP) Server exposes embedded debug tools over HTTP, allowing any MCP-compatible AI client such as GitHub Copilot Chat, Claude Code, or ChatGPT to interact with live debug sessions.
Instead of issuing individual commands, AI clients can call debug tools programmatically, executing actions against GDB and receiving structured results in return.
This creates a standardized interface between AI agents and embedded debugging workflows, making it possible to build more flexible, multi-step, and tool-driven debugging experiences.
Why This Matters for Embedded Teams
Embedded debugging is a high-friction, expert-driven activity. The AI Debug Assistant helps reduce that friction by:
- Automating repetitive debug workflows through natural language interaction
- Enabling AI-assisted root-cause analysis using live, trusted debug context
- Providing a standardized interface for integrating AI tools in embedded debug sessions
- Preserving determinism and control for safety-critical and hardware-proximate development
The result is faster insight without compromising transparency or engineering rigor.
Built Into CodeFusion Studio
The AI Debug Assistant is built on the Model Context Protocol and integrates directly with the CodeFusion Studio Debug Manager and existing debug workflows.
The MCP Server can be started manually from the Visual Studio Code Command Palette, with an option to enable automatic activation when the extension loads via the CodeFusion Studio extension settings.
As AI becomes an increasingly important part of embedded software development, CodeFusion Studio provides a foundation that is open, extensible, and grounded in real debug workflows.
Learn more about CodeFusion Studio and embedded AI development
Getting started with the AI Debug Assistant
Tags
Comments
Join the conversation at EngineerZone
Opinions expressed in the content posted here are the personal opinions of the original authors, and do not necessarily reflect those of Analog Devices, Inc (ADI) or its subsidiaries. The content is provided for informational purposes only and is not meant to be an endorsement or representation by ADI or any other party. This site may also provide links or references to non-ADI sites and resources. ADI makes no representations, warranties, or other commitments whatsoever about any non-ADI sites or third-party resources that may be referenced, accessible from, or linked to this site.